
Key Takeaways
- The crypto market can be very unpredictable, and prices can jump or crash in a matter of minutes.
- Bitcoin liquidation heatmaps come in as a solution to this problem, as a visual representation of where liquidations have happened (or might happen).
- Think of a Bitcoin liquidation heatmap as very similar to a traffic congestion map.
- However, instead of showing car congestion, it shows levels where large amounts of traders have positions opened.
- Traders can study these heatmaps and identify key price levels where the market might react sharply
The crypto market can be very unpredictable. Prices can jump or crash in a matter of minutes, creating both opportunities and problems for many traders.
As a workaround for this problem, many traders rely on tools.
One of the most powerful of these tools is the Bitcoin liquidation heatmap. While using this tool might sound complex, think of it like a visual representation of where liquidations have happened (or might happen) in the market.
Here’s why this tool can give you an edge over other traders and how to make the most of it.
What is a Bitcoin Liquidation Heatmap?
Think of a Bitcoin liquidation heatmap as very similar to a traffic congestion map.
However, instead of showing where cars are piled up, it shows price levels where large amounts of traders have positions opened.
Leverage trading in the futures or options markets allows traders to borrow funds and amplify their positions.
While this leads to higher profits for many of these traders, it increases their risk exposure.
This is because if the market moves against them, they may be liquidated.
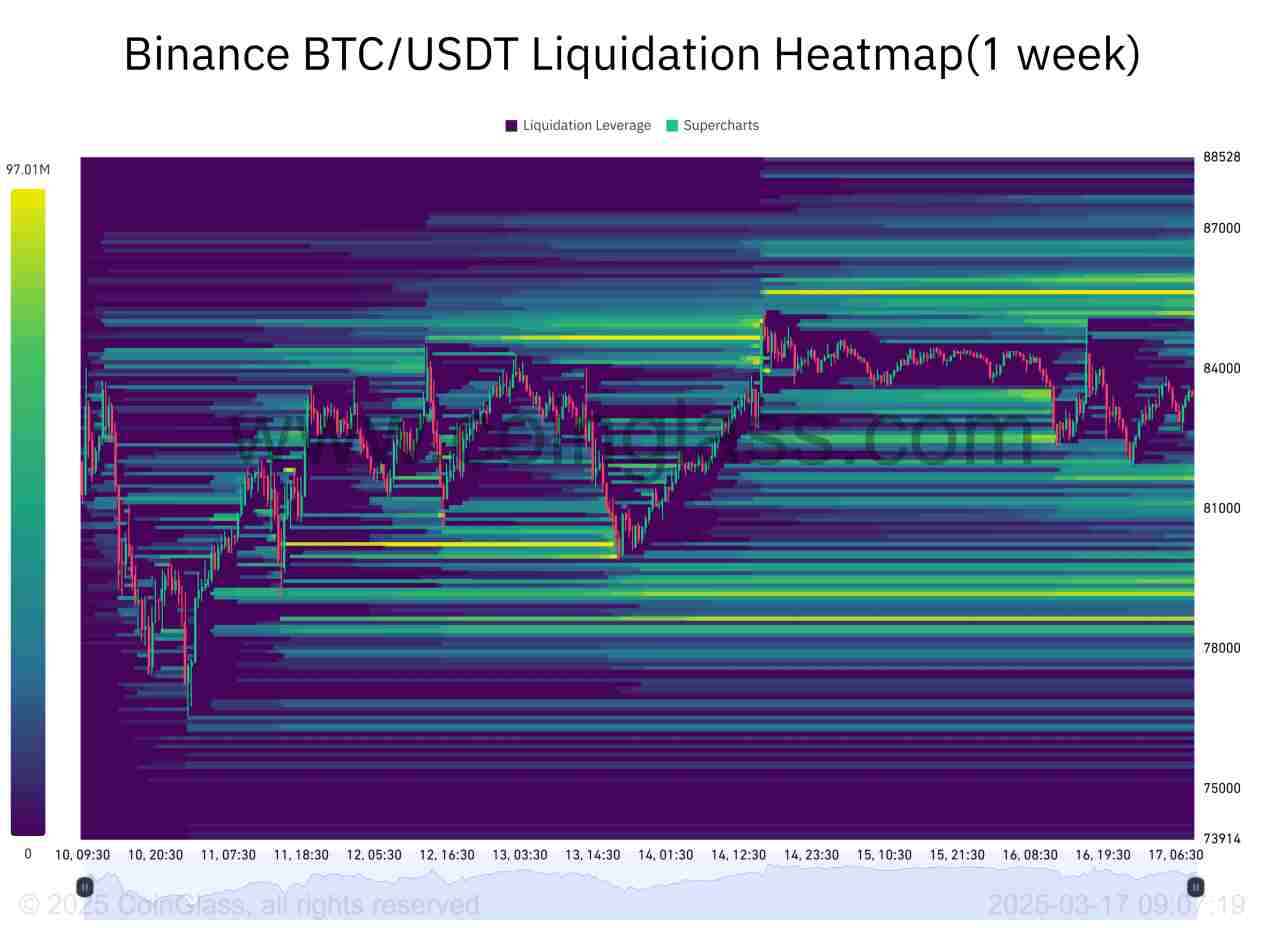
The Liquidation heatmap takes this data and presents it using color gradients (each of them showing different levels of liquidation risk).
Consider the snapshot of Bitcoin’s liquidation heatmap from Coinglass above.
The red areas show high concentrations of liquidation points. Yellow or orange areas show moderate levels of liquidations.
On the flip side, green areas show minimal liquidation activity. This means that prices are less likely to swing sharply from there.
Traders can study these heatmaps and identify key price levels where the market might react sharply.
Understanding Liquidation
Before jumping deeper into how heatmaps work, it is important to understand the concept of liquidation itself.
When a trader uses leverage, they are borrowing funds from the exchange to increase their position size.
This is a great way to make more money from a regular trade. However, if the trade goes against them, the exchange forcefully kicks them out of their position to prevent further losses.
As an example, consider a trader who uses 10x leverage in a Bitcoin position.
Bitcoin currently trades at around $85,000—which means that they can purchase a whole $BTC token using $8,500.
The problem with this is that if Bitcoin were to drop to $80,000, the trader would have lost more than half of their capital.
When a cryptocurrency moves in a certain direction and causes a small amount of liquidity, it often creates a chain reaction and adds more buying or selling pressure.
In essence, large price changes can result from a small move, if enough traders are involved.
How Do Traders Use Liquidation Heatmaps?
Traders rely on liquidation heatmaps for several key purposes. If done right, this tool can help to:
1. Identify Support and Resistance Levels
The red zones in the heatmap represent crucial support or resistance levels.
If the price is near a red zone, it might bounce back or break through and rally/crash.
Heatmaps help traders make decisions on the spot, about whether to enter or exit trades.
2. Set Strategic Stop-Loss Orders
Heatmaps can help traders avoid placing stop-loss orders too close to high-liquidation zones. This can go a long way towards preventing unnecessary liquidations in temporary price spikes.
3. Predict Volatility
If a large cluster of liquidations sits just above or below the current price, traders know that possible volatility could be incoming. They can then prepare for these moves by adjusting their positions.
4. Understand Market Sentiment
Liquidation clusters reveal how traders are positioned in the market. If too many traders are betting in one direction, the market tends to move opposite to this and cause a liquidation cascade.
5. Time Entries and Exits
Traders can study where major liquidations might occur and then make better decisions about where to enter or exit the market. For example, traders buying near a large liquidation zone after a wave of liquidations can be a great entry point.
Why Liquidation Heatmaps Matter?
Liquidation heatmaps provide other insights into the market’s behavior, and understanding them can upgrade a trader’s abilities within the space.
This tool matters, because identifying liquidation levels can help traders reduce their exposure to unnecessary risks.
Traders also rely less on gut feelings when making decisions, and can enter or exit based on data.
In addition, the market tends to become heavily manipulated by large traders (whales) who intentionally trigger liquidations.
Retail traders can easily spot these patterns and avoid falling into traps.
Overall, the Bitcoin liquidation heatmap is a powerful tool.
It helps traders navigate the crypto industry more efficiently, considering how unpredictable it can be.
Understanding where large liquidations are likely to occur can help any trader anticipate volatility and refine their strategies.
However, it is important to remember that heatmaps are just one piece of the puzzle when it comes to being profitable as a trader.