
Key Insights
- The popularity of crypto has led many investors to look for new ways to take advantage of price movements.
- Some of the ways to make profits from the market include trading and positioning with market trends.
- A great way to go about this is through technical analysis.
- Technical analysis is a form of market analysis in which traders use things like charts and indicators to predict market movements.
Crypto has grown from being a relatively unknown asset class to being a mainstream financial asset in the last decade.
However, as its popularity grows, more and more investors are looking for ways to profit from its price movement.
One of the most common ways they do this is by predicting price action and then trading based on their intuition.
A great aspect of this trend is technical analysis, as we will soon see.
What exactly is technical analysis, and how can it help you to become a better crypto investor?
The Basics of Technical Analysis
The basic idea behind technical analysis is studying historical price movements to predict the future.
This is unlike technical analysis, which looks at things like the news, a cryptocurrency’s technology, its team, or even its market demand.
Technical analysis focuses mostly on price charts and patterns.
At its core, technical analysis (or TA) is based on the idea that all information—including news, market sentiment, and even future events—is already reflected in the price of an asset.
This means that any skilled trader can predict the future with decent accuracy by analyzing past price movements.
Key Principles of Technical Analysis
Technical analysis is built on several main pillars, as illustrated below. Here are some of them:
Price Discounts Everything
The idea of this principle is that all information (both public and private) is reflected in the price of a cryptocurrency.
In essence, news, rumors, market sentiment and so on are all priced in.
The translation of the above is that if you see a sudden price movement, there is very likely a reason behind it—markets do not move for nothing.
Price Moves in Trends
This is another interesting aspect of technical analysis, and it states that prices rarely move in a straight line.
Instead, prices tend to follow trends—either upward, downward, sideways, or an unclear trend (also known as choppiness).
Technical analysts try to recognize these trends to gain an edge in the market.
History Tends to Repeat Itself
The final principle is based on history and how predictable human behaviour is.
Past market patterns are driven by human psychology.
As such, they are bound to repeat themselves, sooner or later. Technical analysts try to identify similar patterns in historical charts and make decisions by expecting the same thing to repeat itself.
The Tools of Technical Analysis
Technical analysts have several tools in their belts, and here are some of the most commonly used:
1. Charts
Charts are the bread and butter of technical analysis. They are the foundation of everything and help traders visualize trends, support levels, resistance zones, and price patterns.
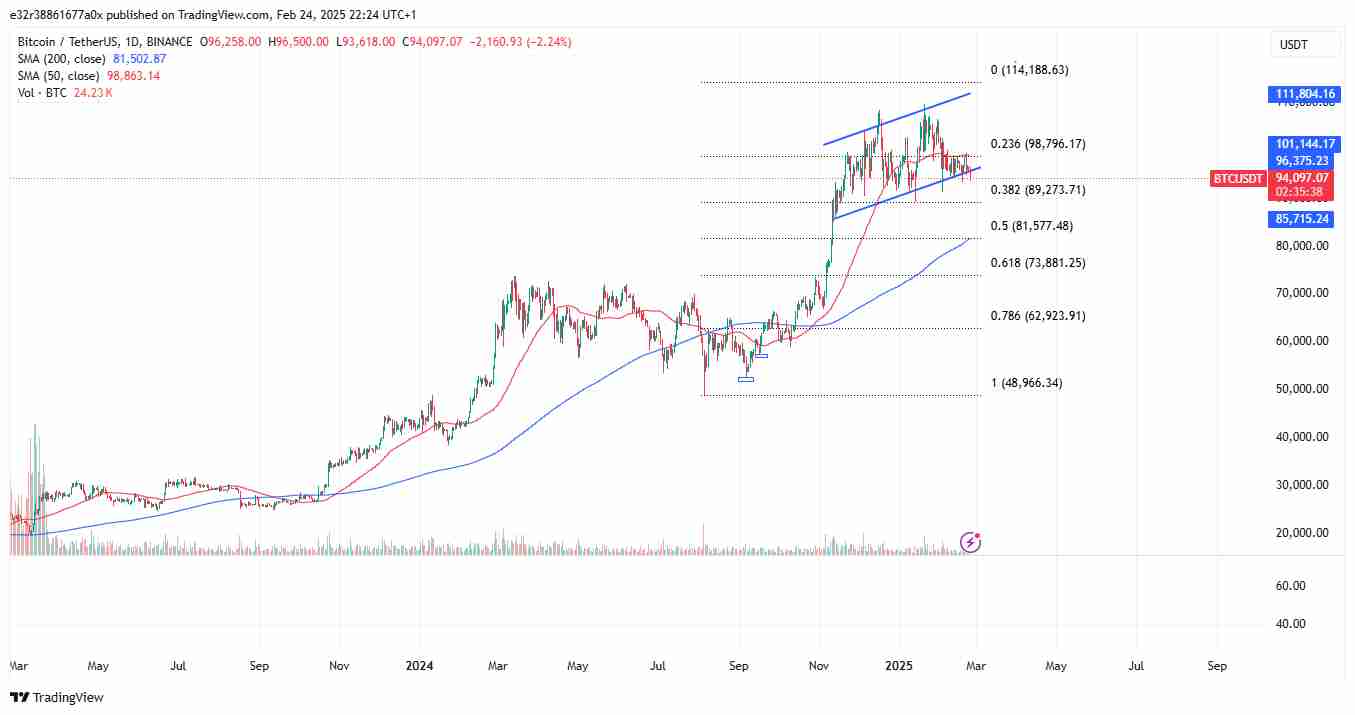
Some of the most common types of charts used in technical analysis include line charts, bar charts, candlestick charts, and step-line charts, each of them with one advantage over the others.
2. Indicators and Oscillators
More than mere chart reading, indicators are mathematical tools that display calculations based on price and volume data.
They are great for confirming trends, measuring momentum, and identifying reversal points.
Some great examples of indicators include moving averages, the Relative Strength Index (or RSI), the Moving Average Convergence Divergence (MACD), and the Bollinger bands, to mention a few.
3. Support and Resistance Levels
These are important for technical analysis and help to show important price points.
These points are historically hard for assets to move above or below and can be great for setting take-profits and stop-losses.
They are also invaluable when it comes to choosing entry and exit points.
Keep in mind that when a cryptocurrency breaks through either support or resistance, it signals a change in trend, and it might be time to make a move as a trader.
Common Chart Patterns
Traders often use chart patterns to predict future price movements. Some of the most common of these include:
Head and Shoulders
These patterns typically indicate a reversal, especially after a strong uptrend or downtrend.
The “head” of this pattern is formed by a peak between two smaller ones (the shoulders).
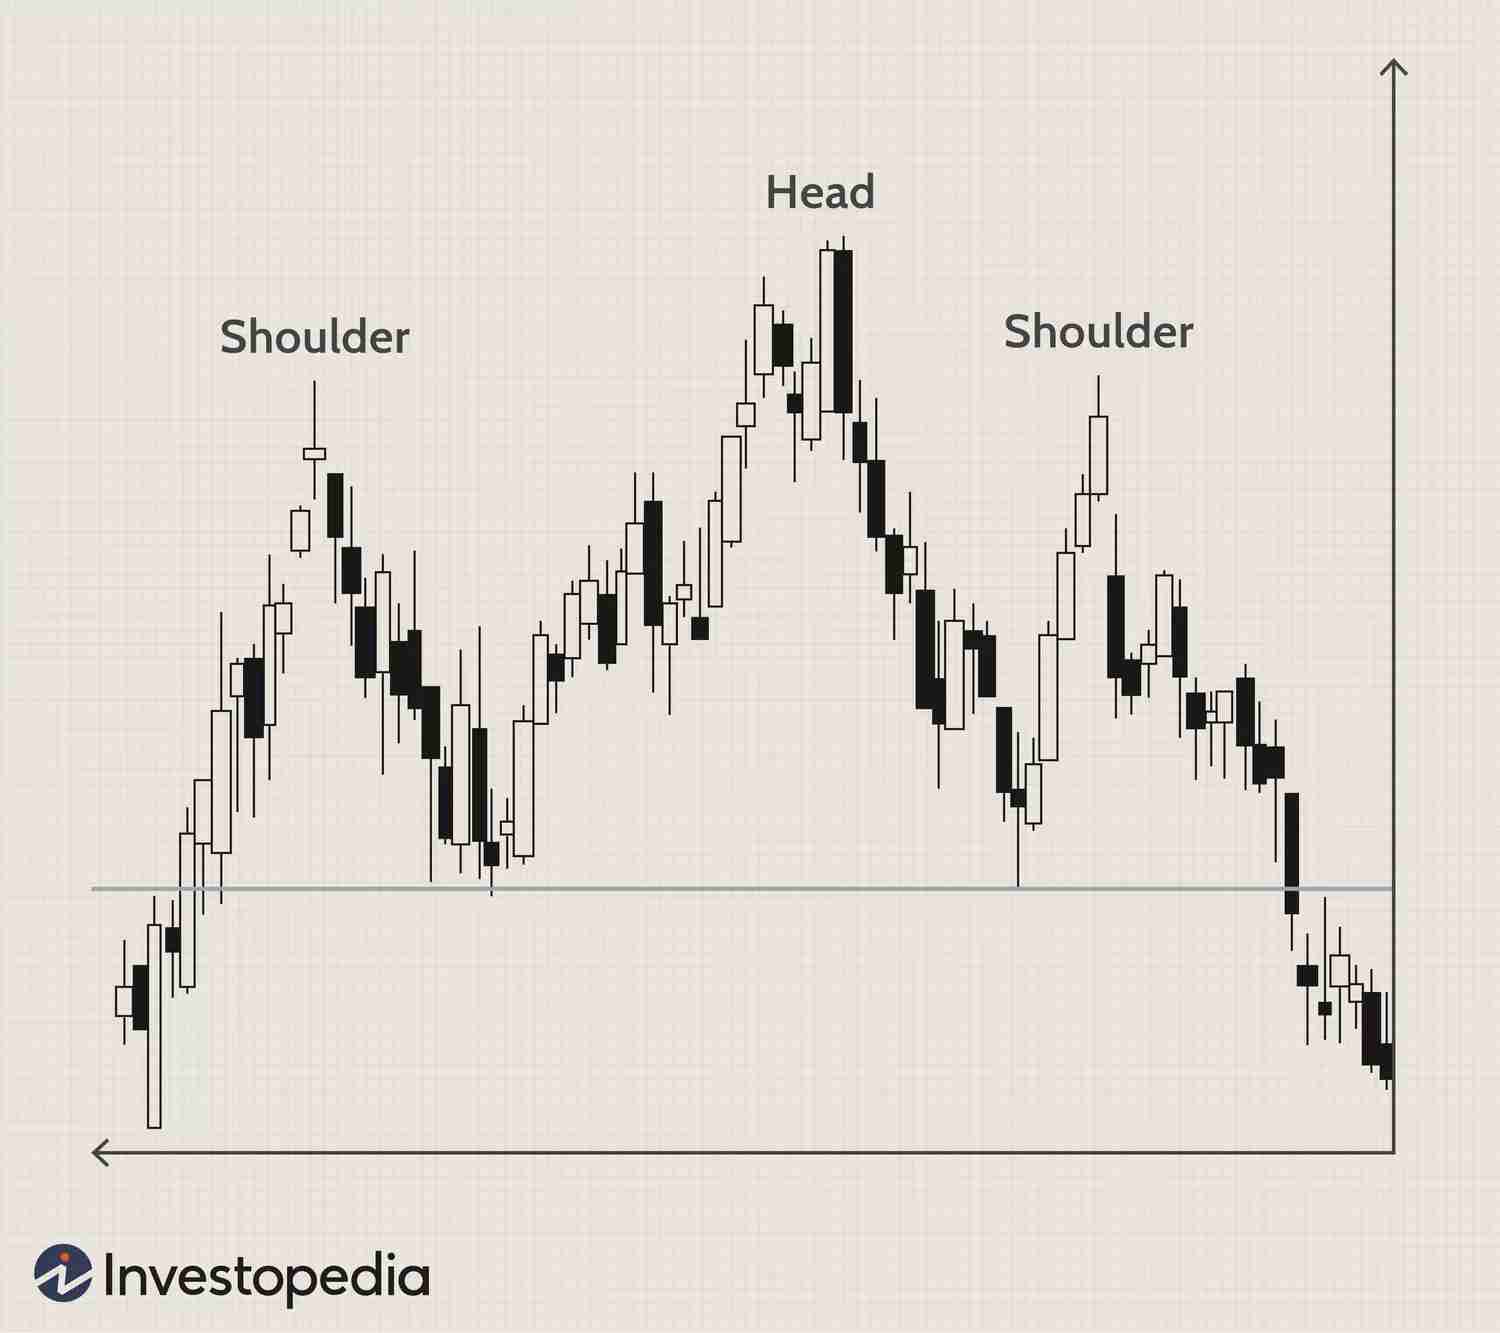
When prices break below the neckline, it typically signals a reversal, and traders must make a move at this point.
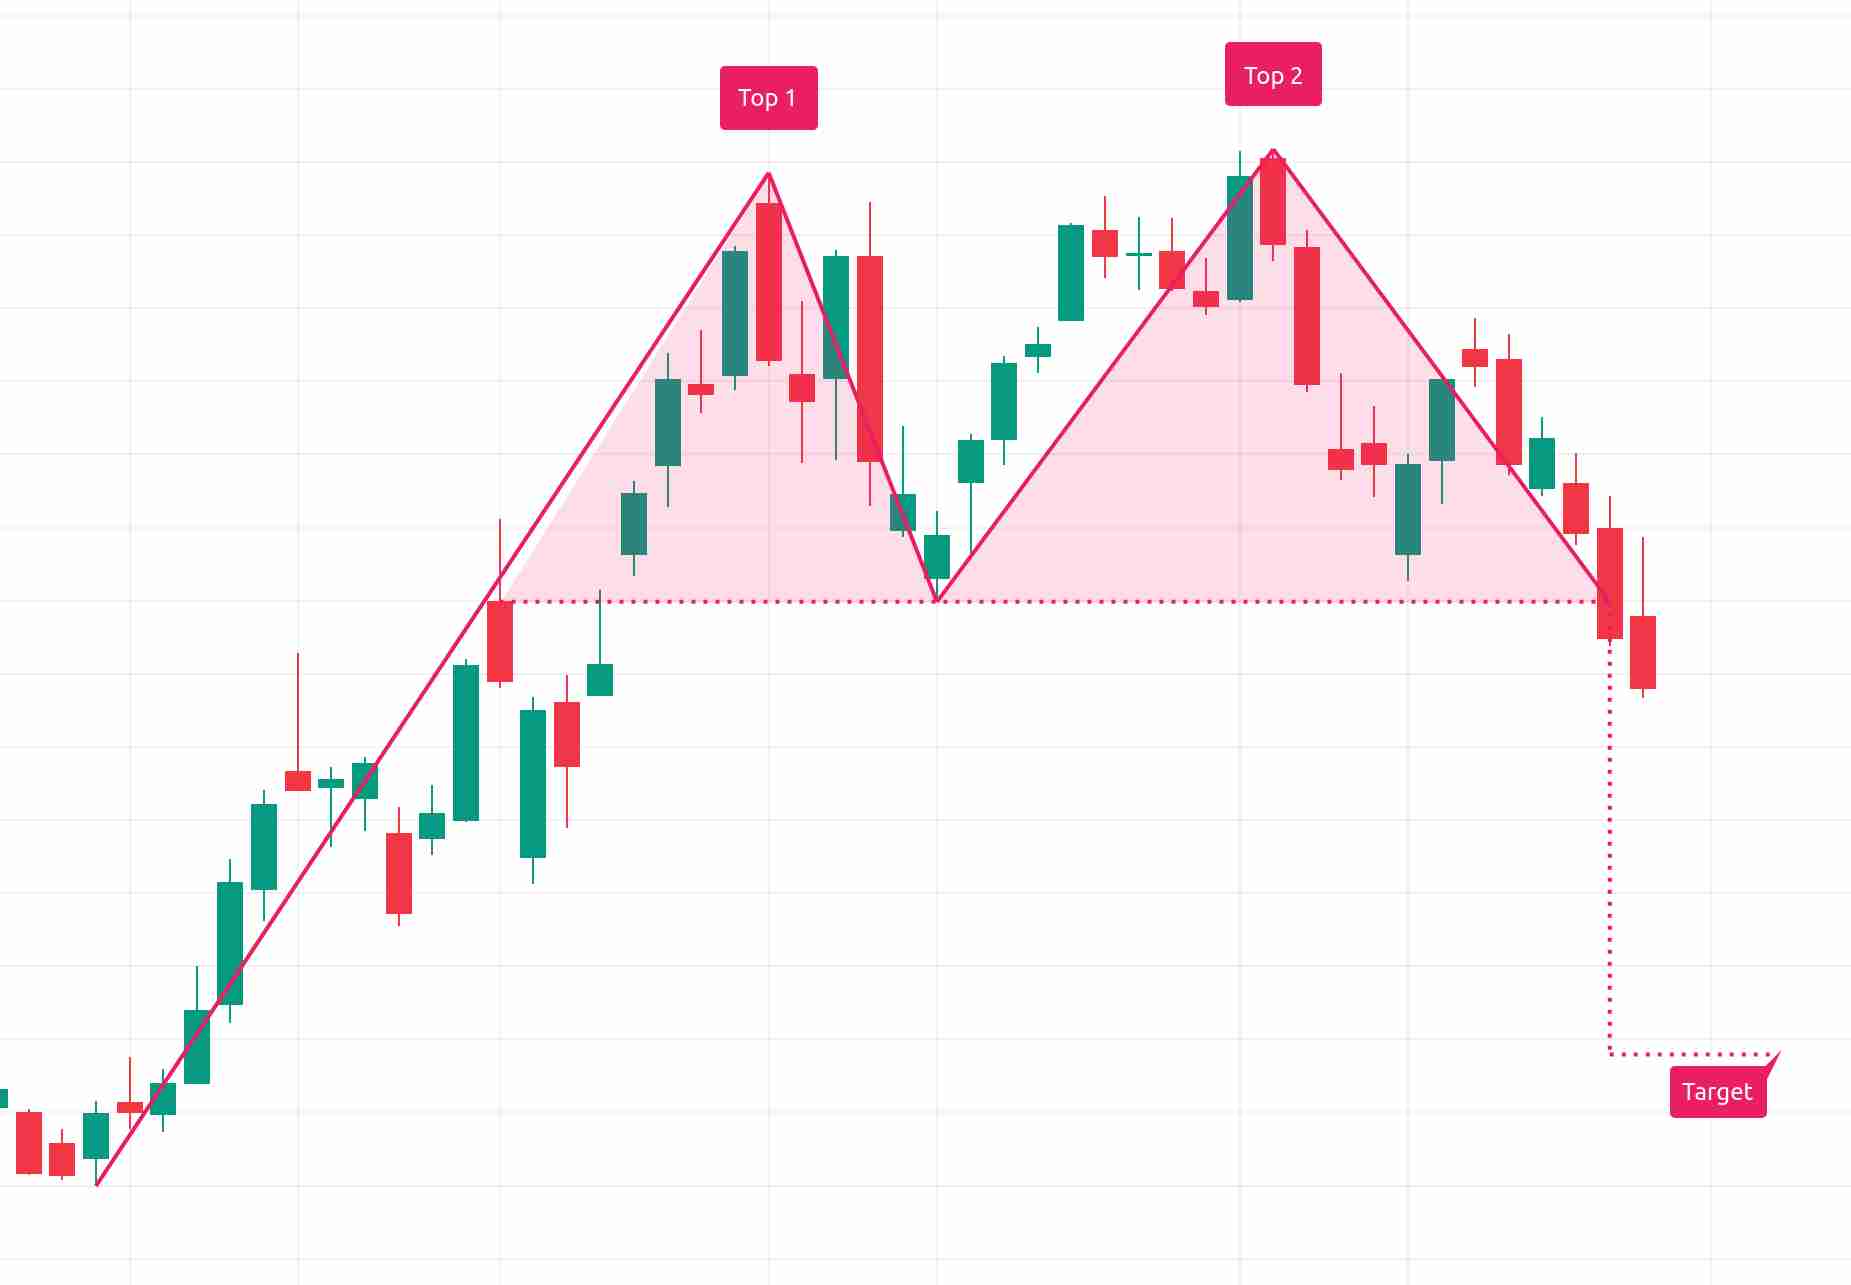
Double Top and Double Bottom
These patterns typically show a price reversal. Double tops happen after prices peak twice at the same level, while double bottoms happen after a downtrend, after the price bottoms twice at the same level.
Triangles
This pattern shows up when the price of a cryptocurrency starts to converge between rising support and falling resistance.
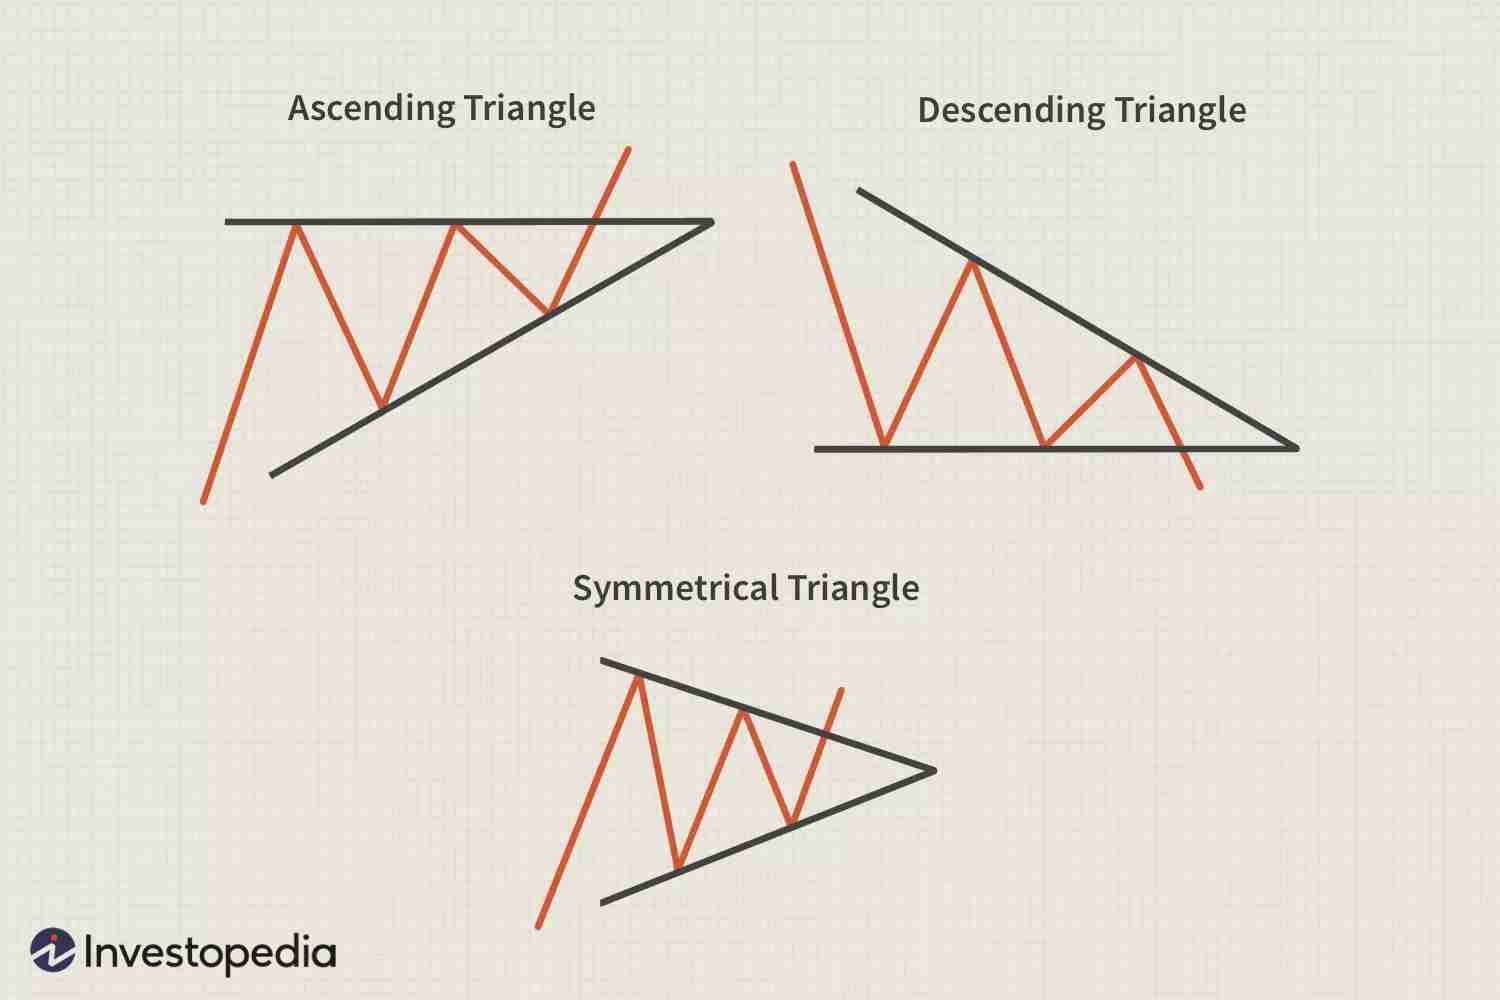
Triangles typically come in three forms, including ascending, descending, or symmetrical triangles.
When technical analysts see these, they know that prices are consolidating and will soon breakout.
Risk Management in Technical Analysis
There are no foolproof strategies to trading crypto. This means that no method, whether technical or fundamental analysis—or even a mix of either—can guarantee profits 100% of the time.
However, this is where risk management comes into play, and here is what to know:
Stop-Loss Orders
These are set in place to automatically sell a cryptocurrency once its price falls below a certain level. This tool comes in handy in case the market moves against a trader.
Position Sizing
This is simply the amount of capital a trader allocates to each trade. Historically, proper position sizing helps to manage risk by making sure that no single trade can greatly affect a trader’s portfolio.
Diversification
The basic idea of diversification is spreading out investments across multiple cryptos (or even asset classes) to reduce the risk of losing it all in any single trade.
Overall, technical analysis is great for predicting price movements, especially when combined with other kinds of analysis.
However, it is again important to remember that TA is not foolproof, and it carries its own fair share of risks.
Traders should use proper risk management to increase their chances of success.