
Key Takeaways
- Ethereum could be on the verge of something massive in terms of bullish price movement.
- Recently, its exchange reserves hit a 9-year low.
- This indicates that investors are taking a bullish approach to the market and are less interested in selling.
- A bullish move towards the $2,800 zone could lead to massive liquidations among the bears.
- Ethereum (ETH) appears to have bottomed out compared to Bitcoin, indicating an altcoin season.
Something interesting happened with Ethereum lately.
ETH reserves on centralized exchanges have now dropped to their lowest levels in nearly 9 years.
This move has fueled speculation about an incoming price rally, especially considering how the price of the cryptocurrency has been dwindling amid an explosion in demand.
These developments have led analysts to believe that ETH might be on the verge of a major move to the upside.
Let’s see how true this might be.
Ethereum Supply at Historic Lows
Data from CryptoQuant shows that Ethereum reserves on exchanges fell to a new low of 18.95 million on 18 February.
This marks the lowest level that this metric has hit since July 2016, when ETH traded at a mere $14.
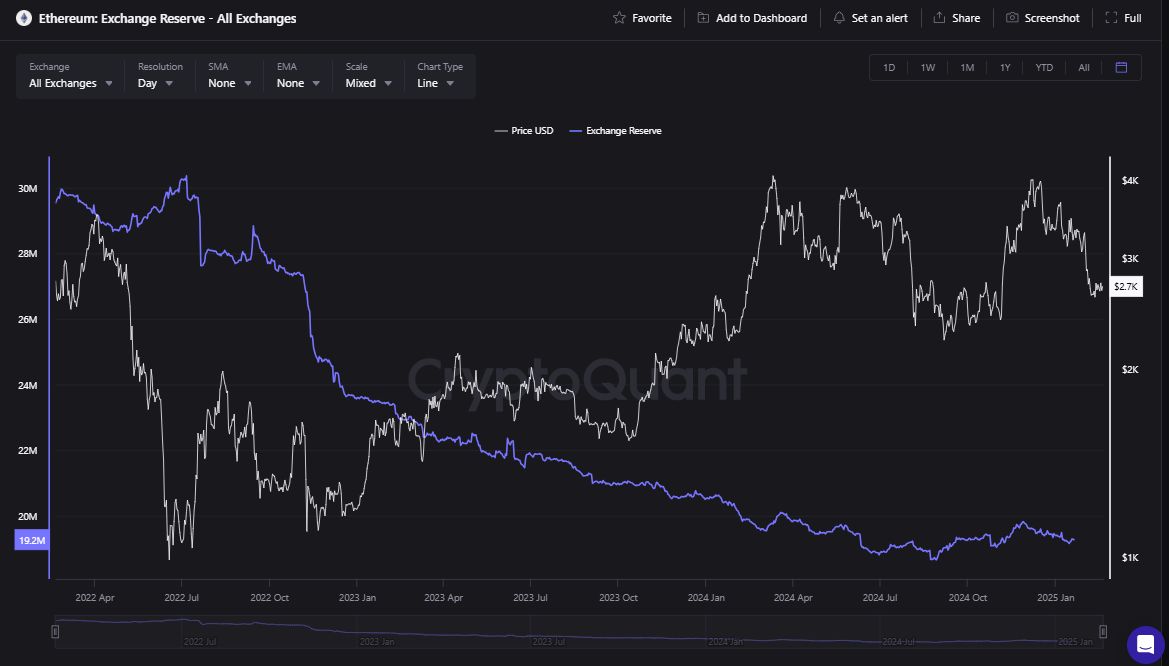
With this in mind, the sharp decline in exchange supply could be a signal of an incoming supply shock—a phenomenon that occurs when the availability of an asset declines, just as demand increases.
Historically, this trend has often led to price appreciation for many assets, and investors are becoming optimistic.
Ethereum’s price currently hovers around the $2,700 price level, and many investors are eyeing an incoming pump towards the psychological $3,000 level.
Why is ETH Leaving Exchanges?
The outflows of ETH from exchanges are interesting enough on their own.
More importantly, it shows that investors might be less and less interested in selling their bags and are moving them into cold storage for the long term.
Despite this positive trend, Ethereum continues to struggle in terms of price over the past year.
According to TradingView data, ETH has declined by around 3.67% on the yearly chart and is down by around 20% every year.
While investor sentiment has been positive so far, ETH continues to face resistance around the $2,750 and $2,800 levels.
If the cryptocurrency manages to break above $2,800 soon, this move could trigger a fresh wave of short liquidations with nearly $1 billion, according to Coinglass.
This move would push prices higher as traders scramble to keep up with their positions.
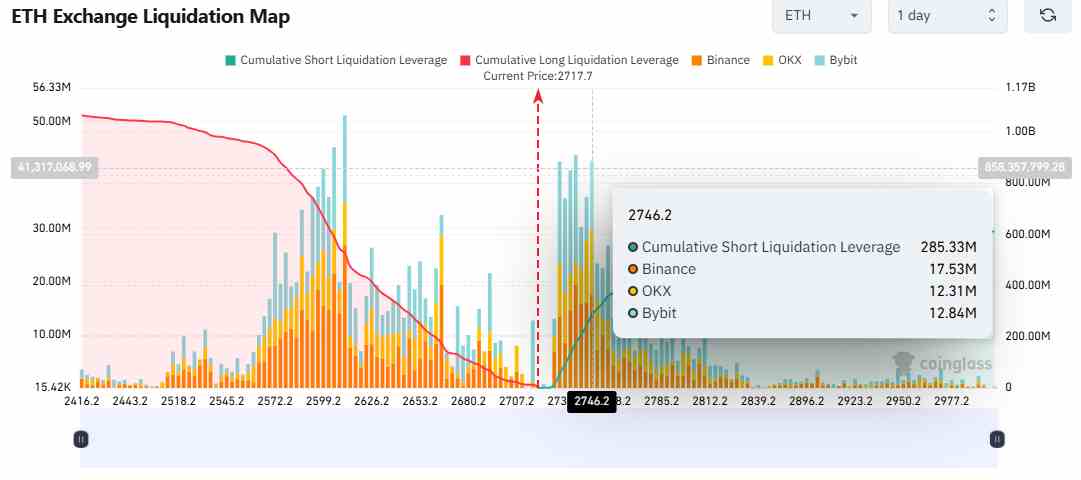
On the flip side, a decline to the $2,600 zone could cause nearly $600 million worth of liquidations.
Could Ether ETFs Be a Game-Changer?
Another major catalyst for a possible ETH comeback is the buzz around the new staking-enabled Ethereum ETFs.
Analysts generally believe that the approval of these staking ETFs could significantly improve the liquid supply of Ethereum and even reinforce its value proposition alongside Bitcoin.
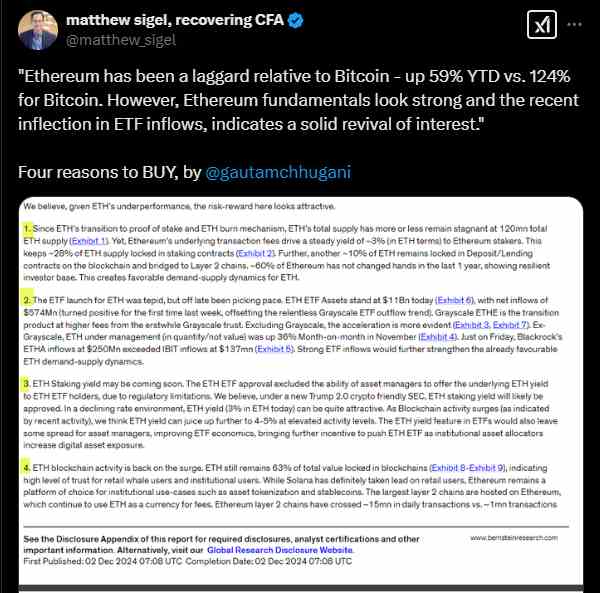
Analysts from VanEck, Bernstein, and other firms have repeatedly pointed out Ethereum’s sluggish performance compared to Bitcoin.
Matthew Sigel, the head of digital assets research at VanEck, recently mentioned that despite this setback, ETH’s fundamentals seem strong compared to Bitcoin’s, and Ethereum is making a strong bullish case.
At the moment, Ethereum ETF issuers are seeking regulatory approval for this staking feature, which could significantly drive up demand for the asset if approved.
Ethereum’s Next Move—A Breakout or More Consolidation?
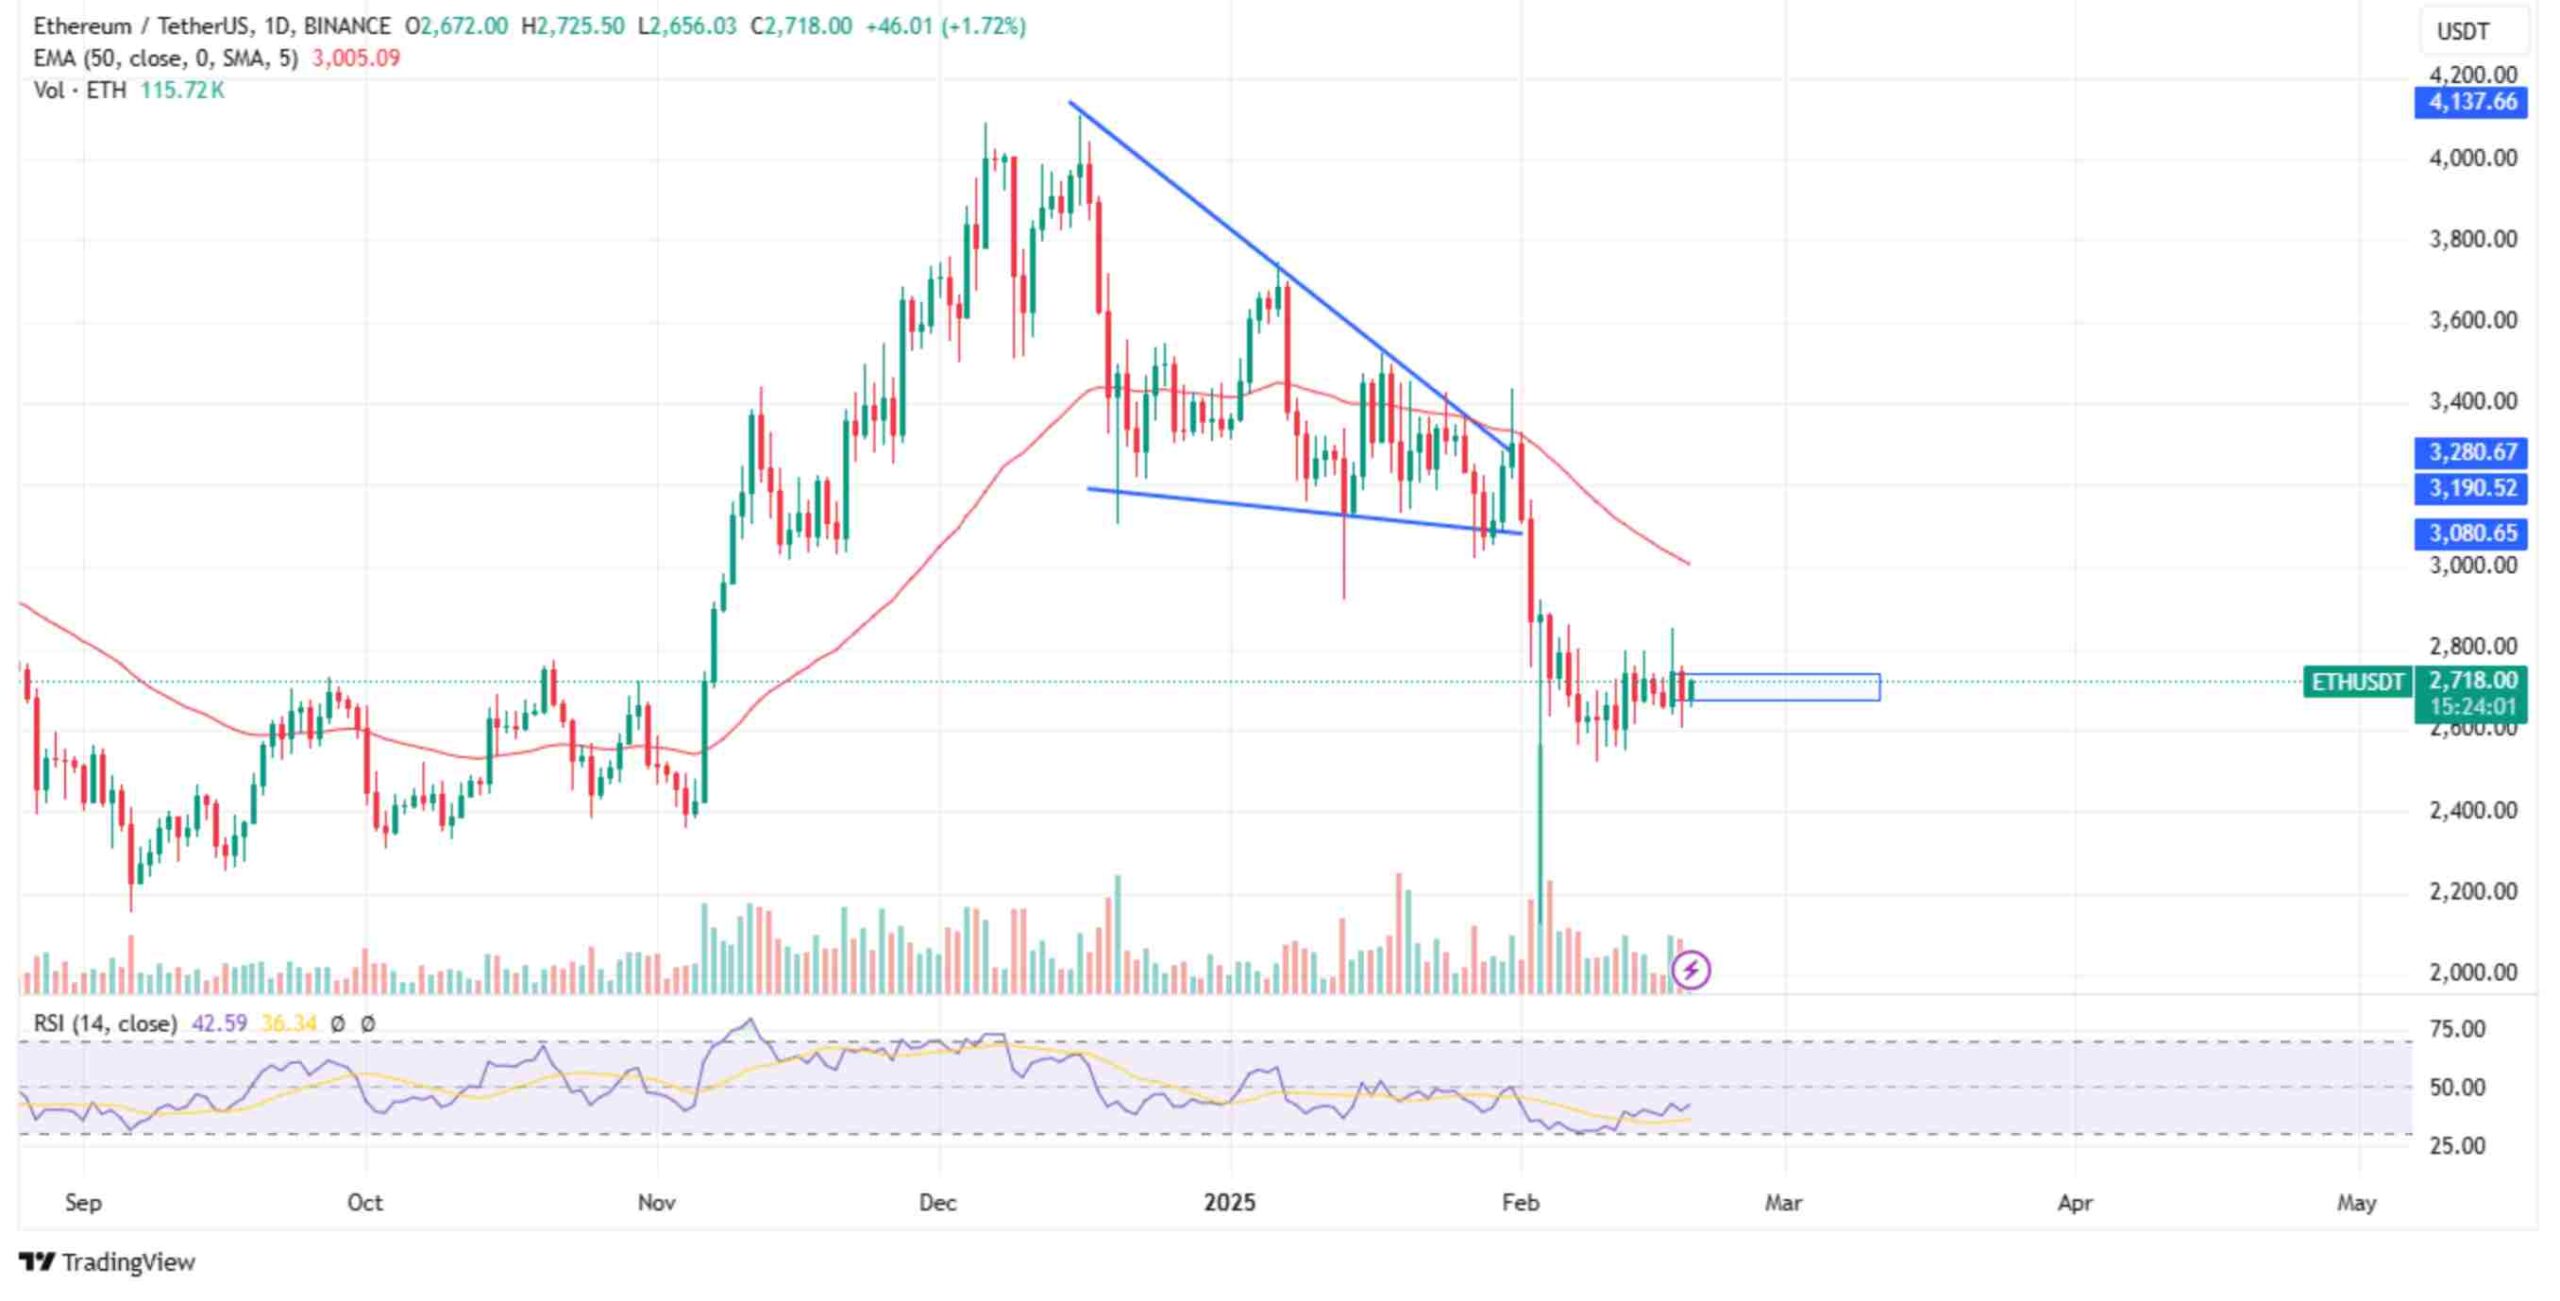
According to technical indicators, ETH could be on the verge of an incoming breakout.
The Ethereum daily chart shows that the cryptocurrency is trading within the lower Bollinger bands, as illustrated below:
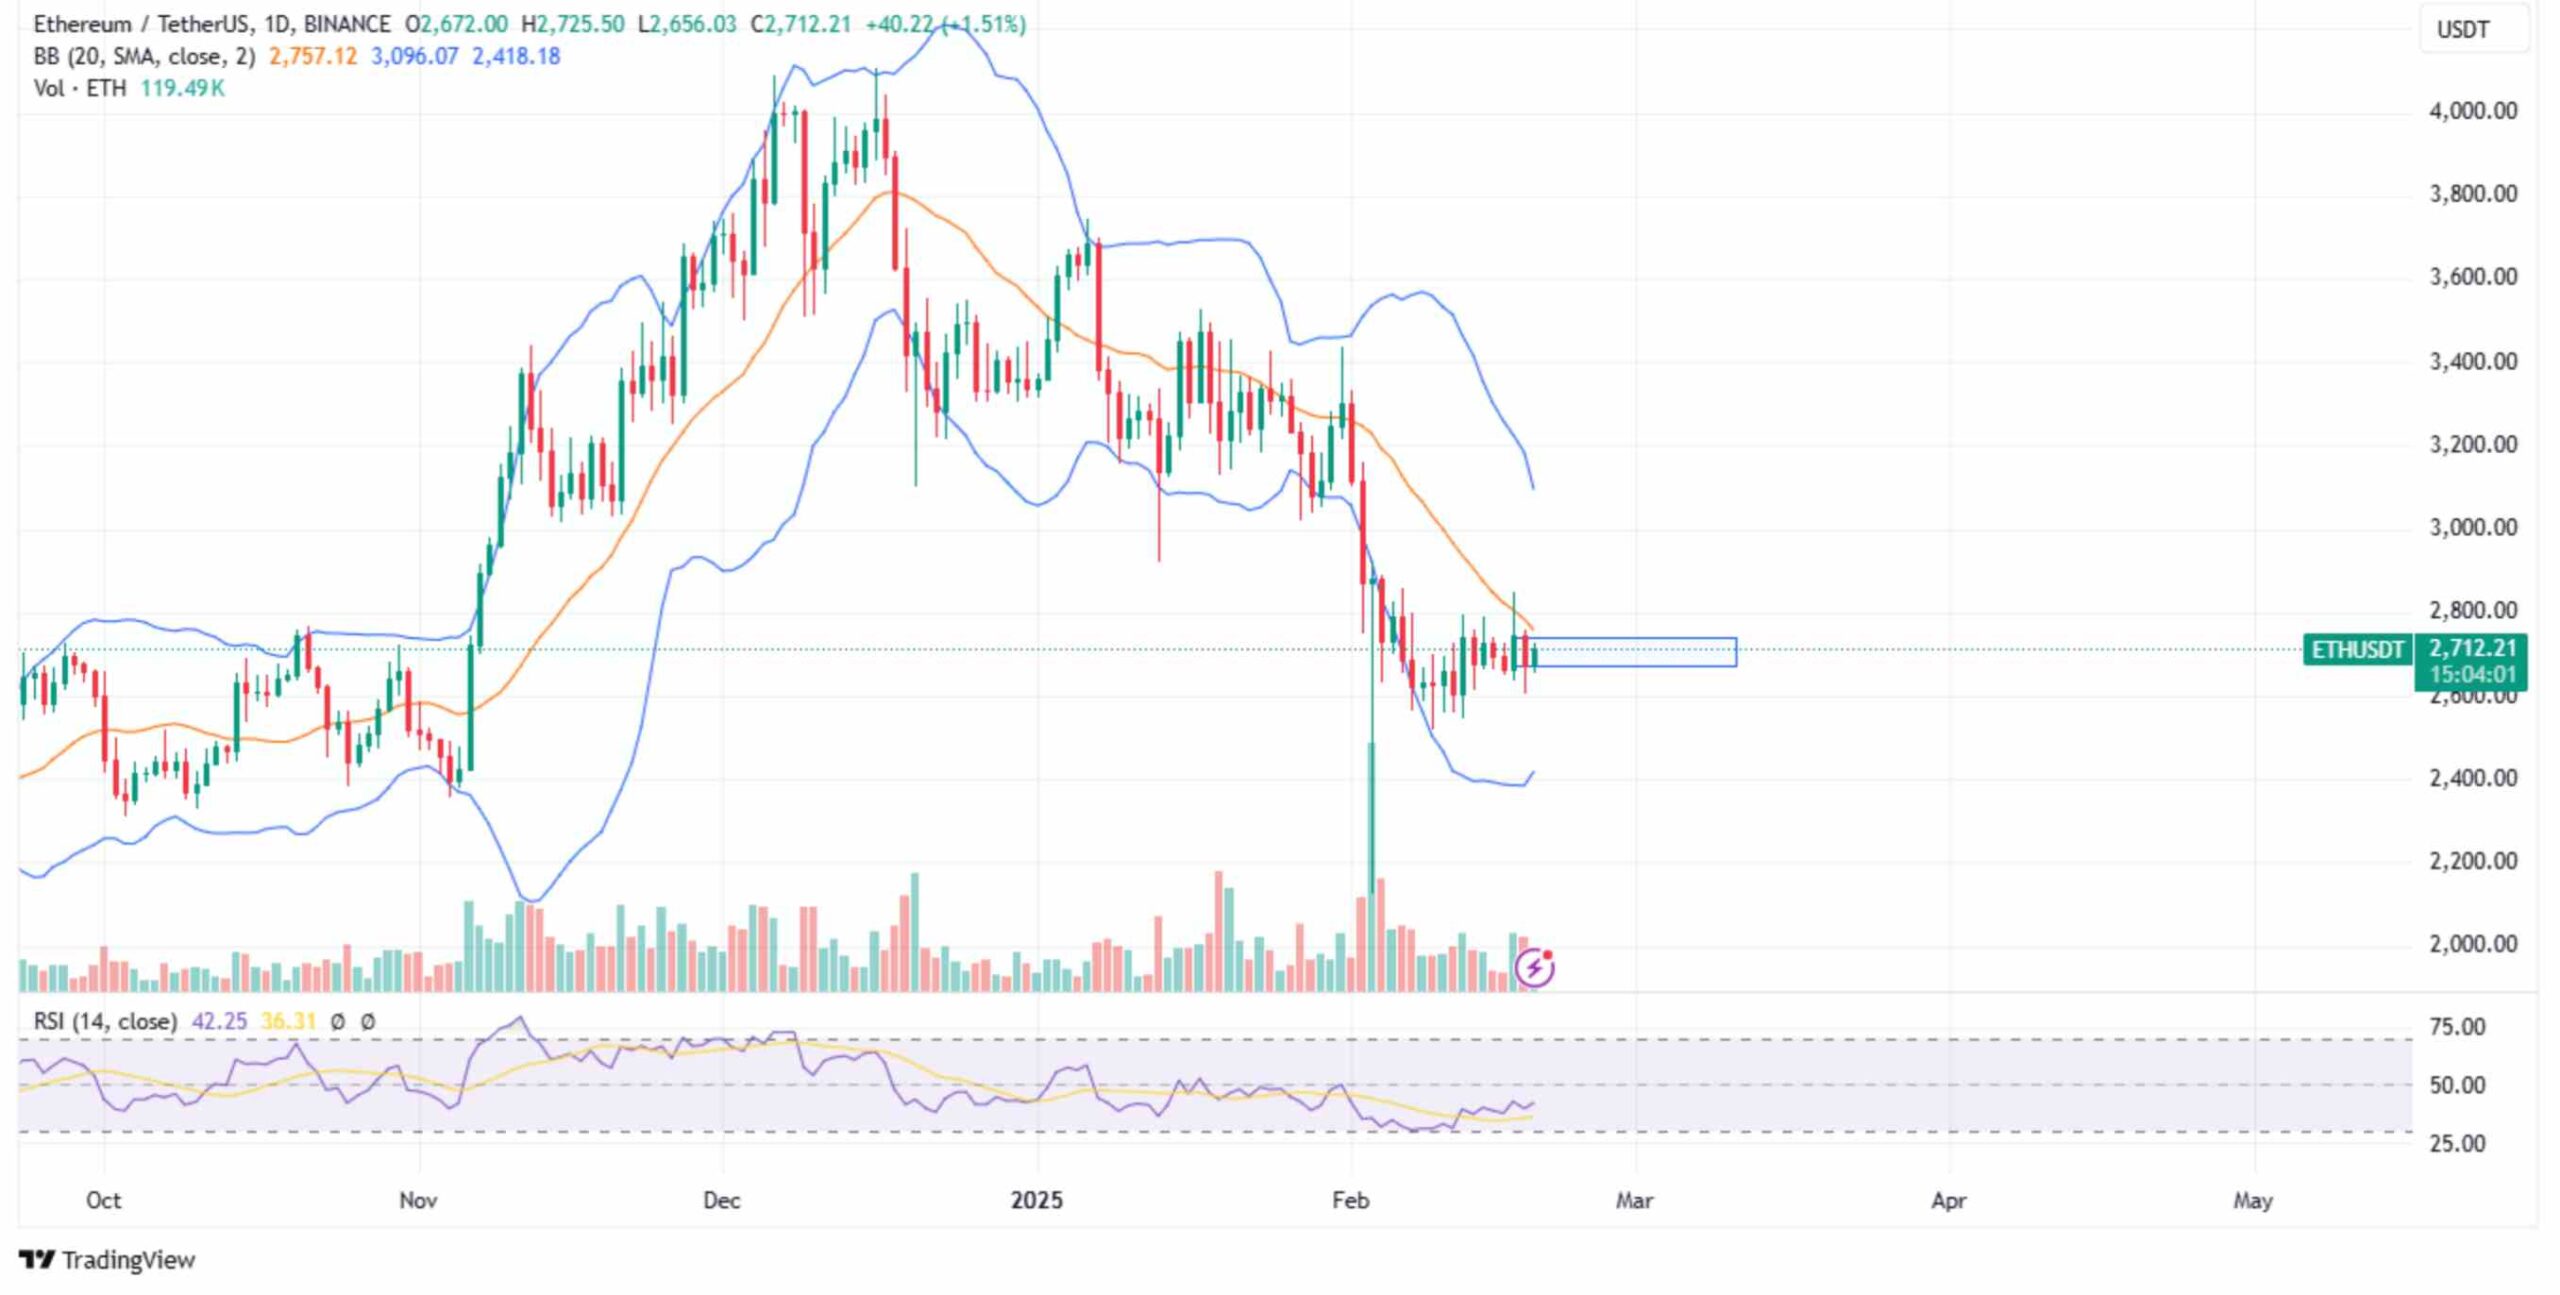
This means that ETH is held under the middle band somewhere around $2,700.
In essence, ETH could be looking at a move toward the upper band around $3,000 if it successfully clears the $2,725 and $2,755 resistance levels.
On the flip side, if ETH fails to break these resistance levels, another pullback could be in the works, as it falls further toward the $2,500 and $2,440 levels.
Somewhere around these price levels, the cryptocurrency can then attempt another move upward.
Analysts Predict $10,000 ETH?
Analysts generally believe in Ethereum’s potential for a comeback.
One of these is the popular analyst Crypto Yodhha, who recently pointed out that ETH’s price structure is similar to its performance in the 2019–2020 cycle.
Keep in mind that this structure resulted in a massive 2,550% rally.
If history repeats, ETH could be on the verge of hitting the $10,000 zone or even higher in coming years.
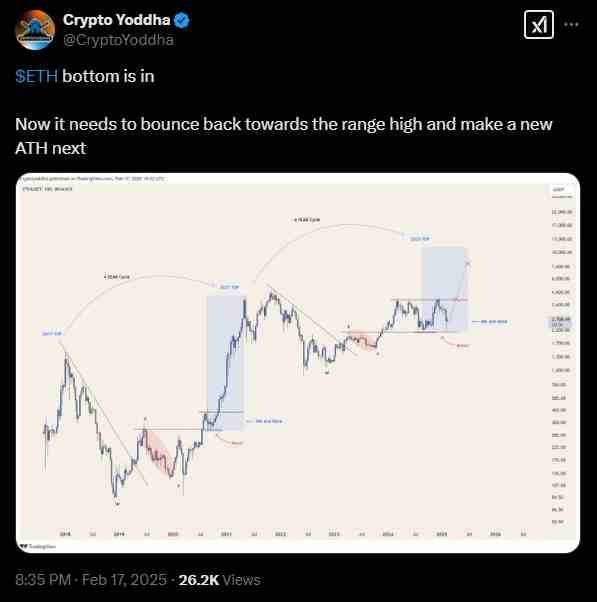
Yodhha made the prediction based on the completion of the WXY pattern, which is technically based on the Elliott Wave Theory.
If ETH follows this prediction, it could be on the verge of a strong bullish phase that possibly outshines Bitcoin’s.
Is Ethereum Bottoming Out?
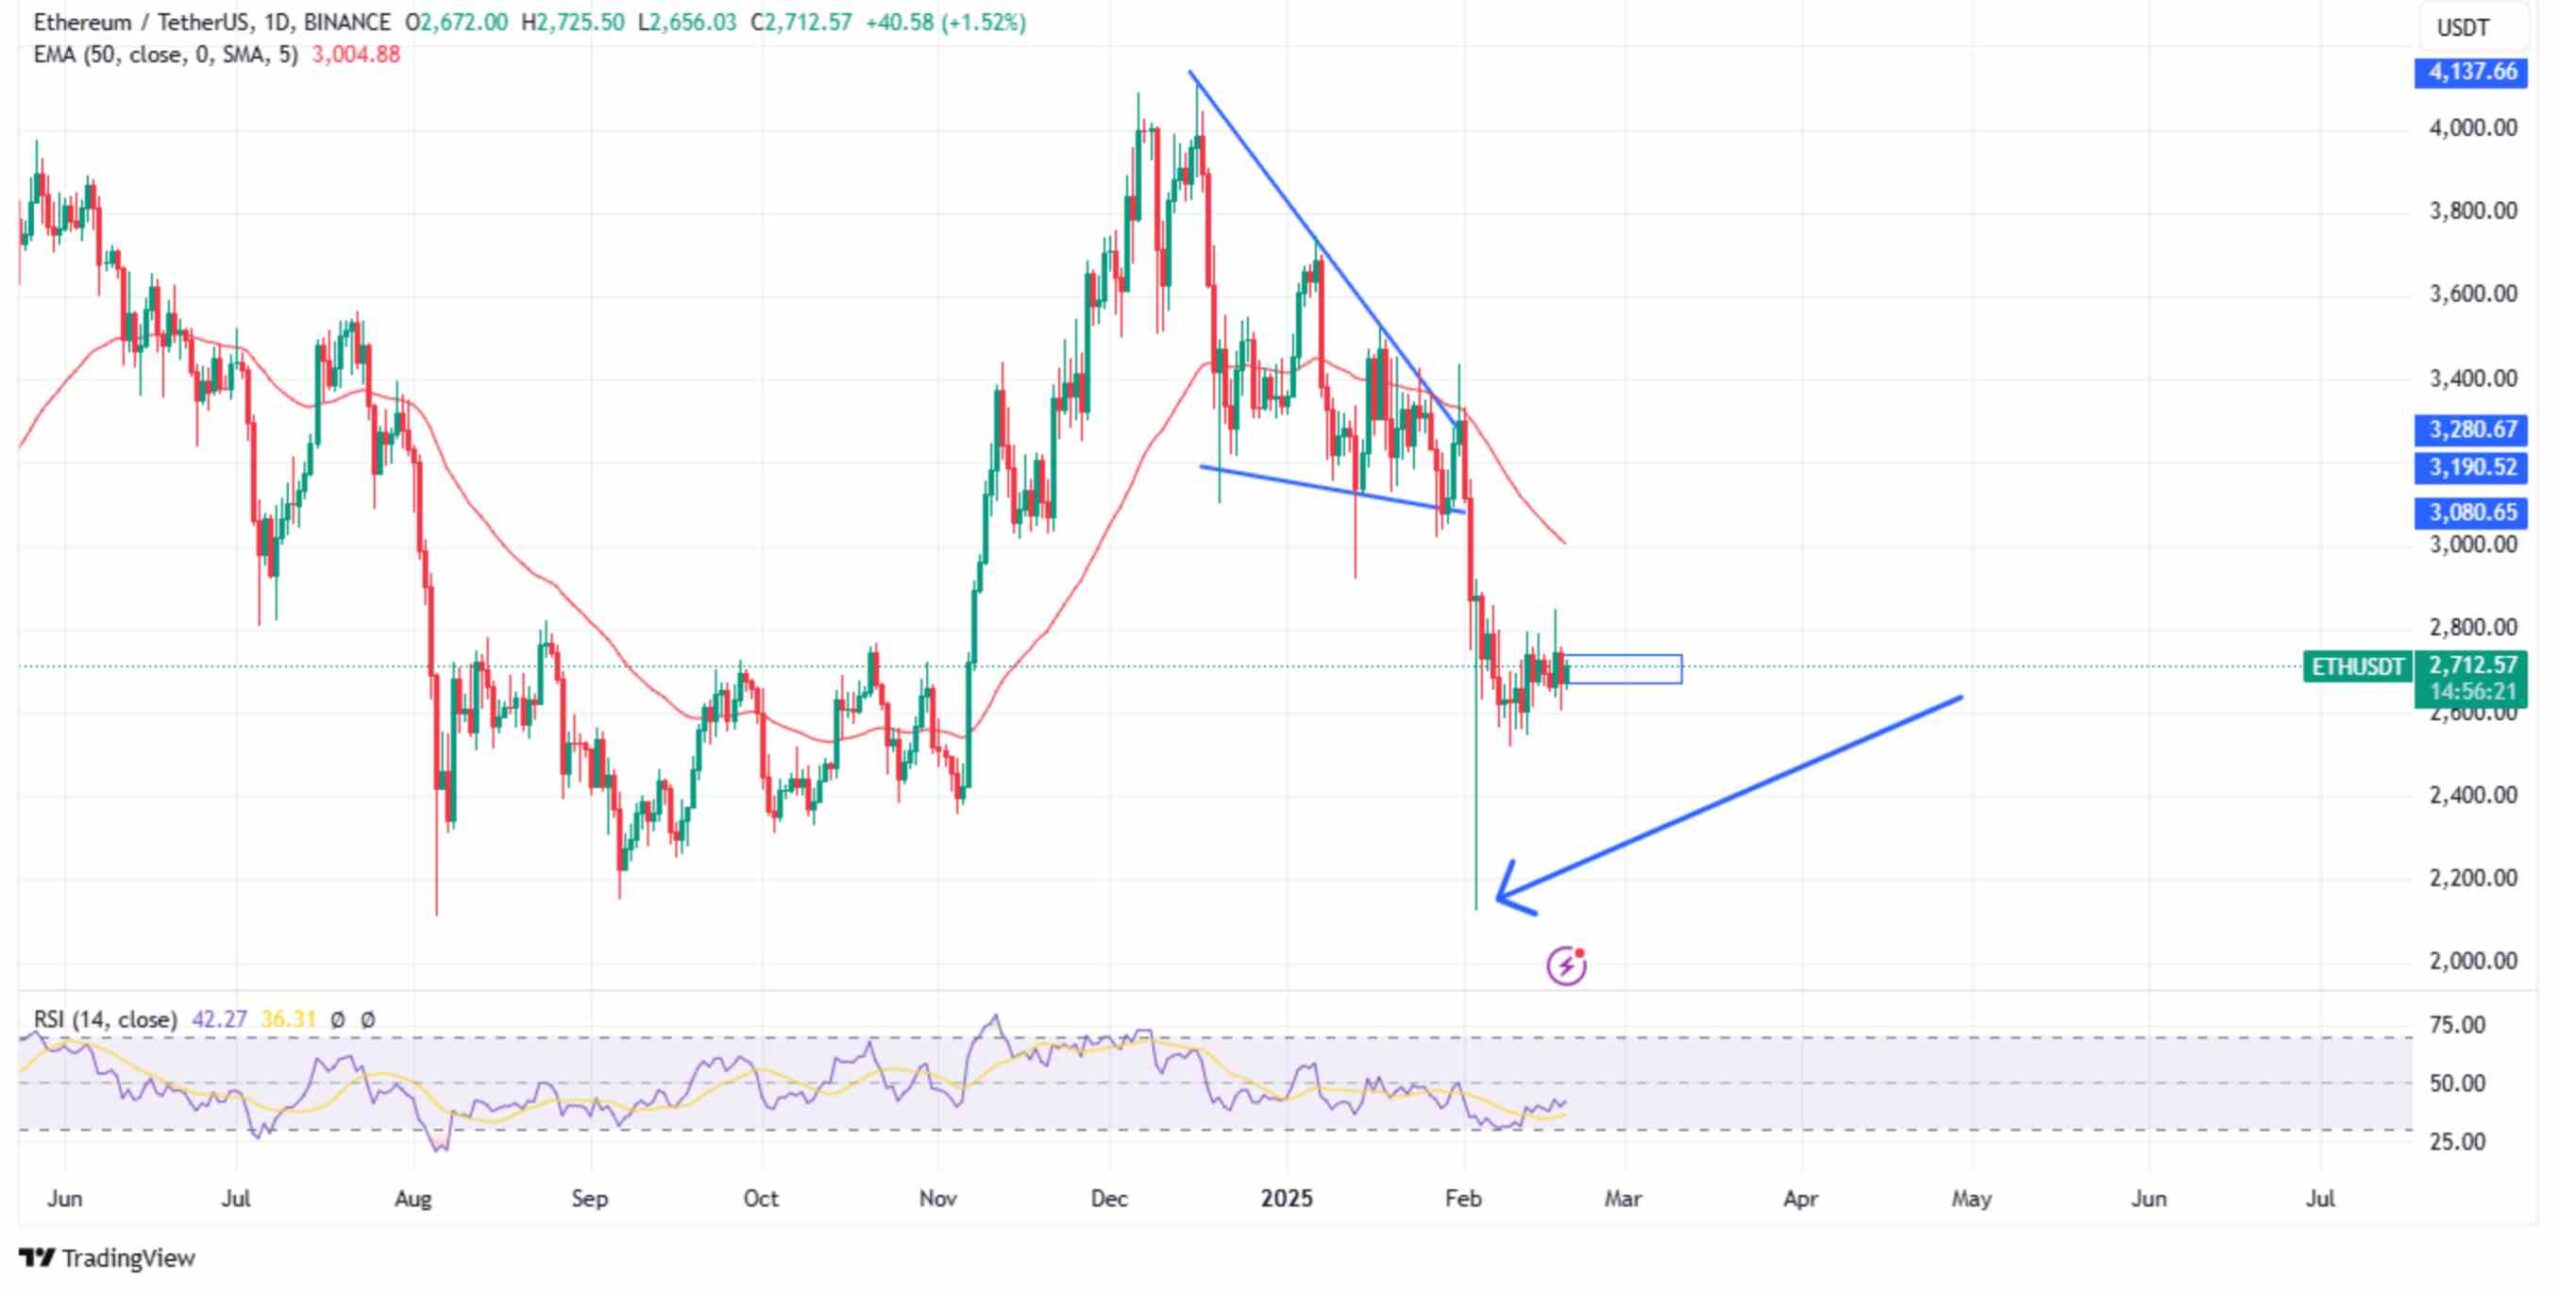
ETH’s recent recovery from its February lows of $2,150 shows that it just might have found a bottom.
Market analysts have pointed out a key support zone around the $2,124 price level, which has historically been a strong demand area.
If ETH maintains this level, it could be a major pointer to a sustained bull market.
Moreover, the Stochastic Relative Strength Index (or RSI) for ETH/BTC pair shows that Ethereum might have bottomed out against Bitcoin.
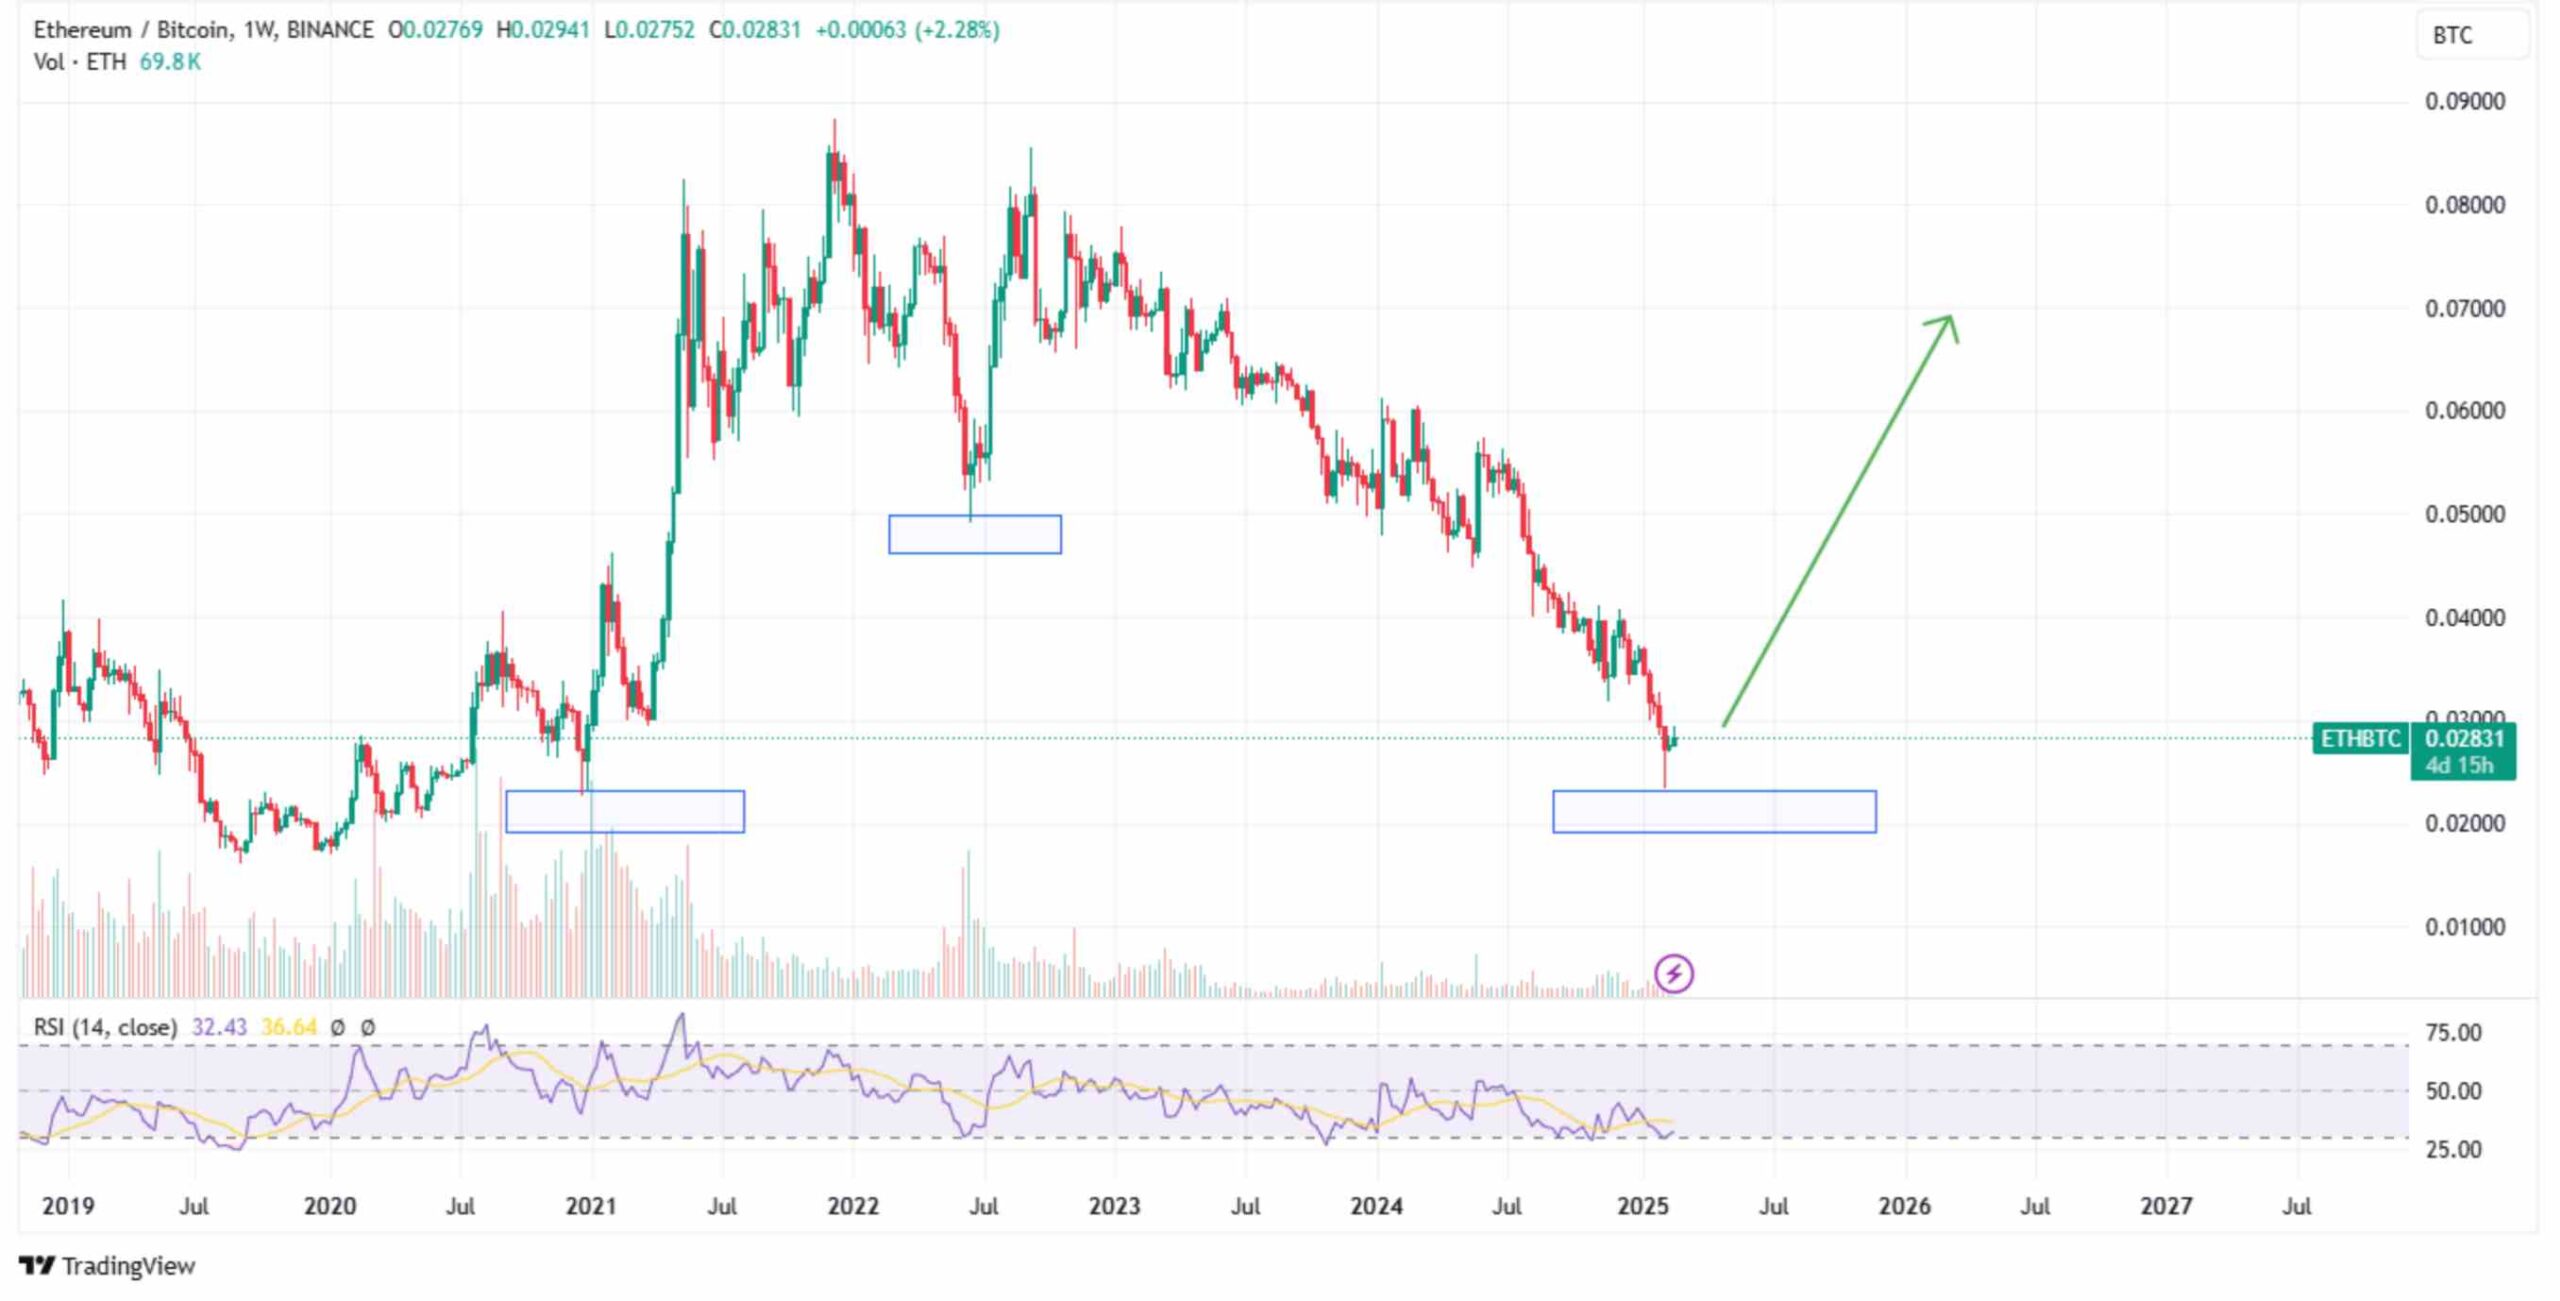
ETH typically rebounds against Bitcoin whenever the RSI hits oversold conditions, indicating that ETH (along with the rest of the altcoin market) could be on the verge of a comeback.
A Perfect Storm for an ETH Rally?
Considering how Ethereum’s exchange reserves have now hit historic lows alongside the incoming staking ETFs, ETH looks increasingly bullish as far as outlooks go.
Investors must remember that short-term pullbacks are still possible.
However, the broader trend shows that ETH is gearing up for a major breakout soon.
If the cryptocurrency can push past its immediate resistance zones, it can establish a run towards $3,000 and even go much higher.
Overall, the next few weeks will be crucial for ETH’s next big move.