Key Takeaways
- XRP is showing both promising and worrying signs on all fronts.
- In the short term, the cryptocurrency is trading within a cup and handle formation, which will likely result in a 20% upside.
- In the long term, XRP is trading within a bear flag pattern, which could lead to a steep correction.
- Exchange outflows have also been on the rise since, indicating lower selling pressure.
- There have been major bullish developments for XRP and Ripple in Brazil.
The XRP price action has formed a classic bullish pattern in the short to medium terms.
This indicates that a price rally to the upside could be in the works.
Exchange outflows have been observed to be on the rise, and here’s why XRP might be on its way to blasting past the $3.00 mark soon.
XRP’s Cup-and-Handle Formation Suggests More Upside
XRP recently dipped strongly after its rally above the $3 mark. The price surged by around 3.5% on Monday this week, to an intra-day low of around $2.63.
This came after a 44% price decline earlier in the month to a low of $1.77 on 3 February.
XRP is back to testing the $2.68 price level, indicating that the bulls are back in action and are pushing back against the bears.
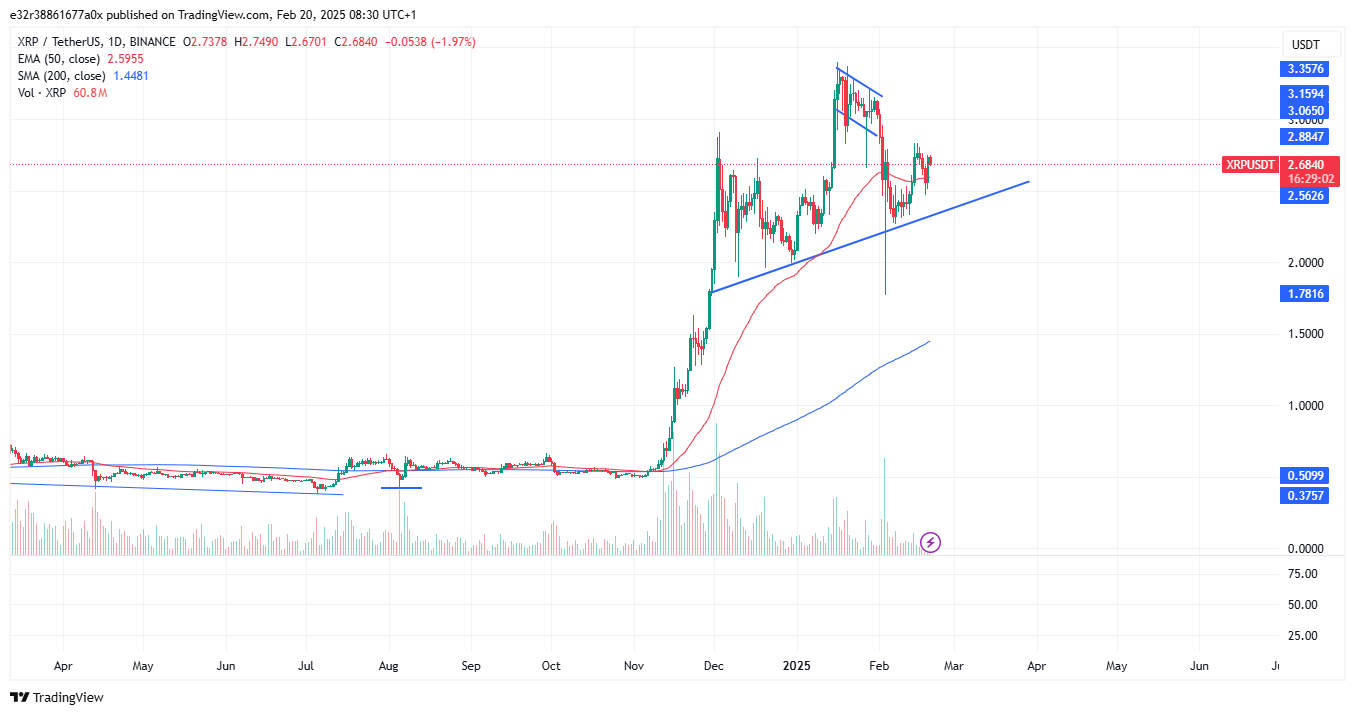
In the long term, the cryptocurrency trades atop an ascending trendline, as shown in the chart below:
However, zooming in on the hourly chart, the cryptocurrency appears to have formed a textbook cup and handle pattern.
This price action typically emerges when the price of an asset recovers steadily after a major pullback (the cup), then consolidates for a while (the handle) before breaking out towards the upside.
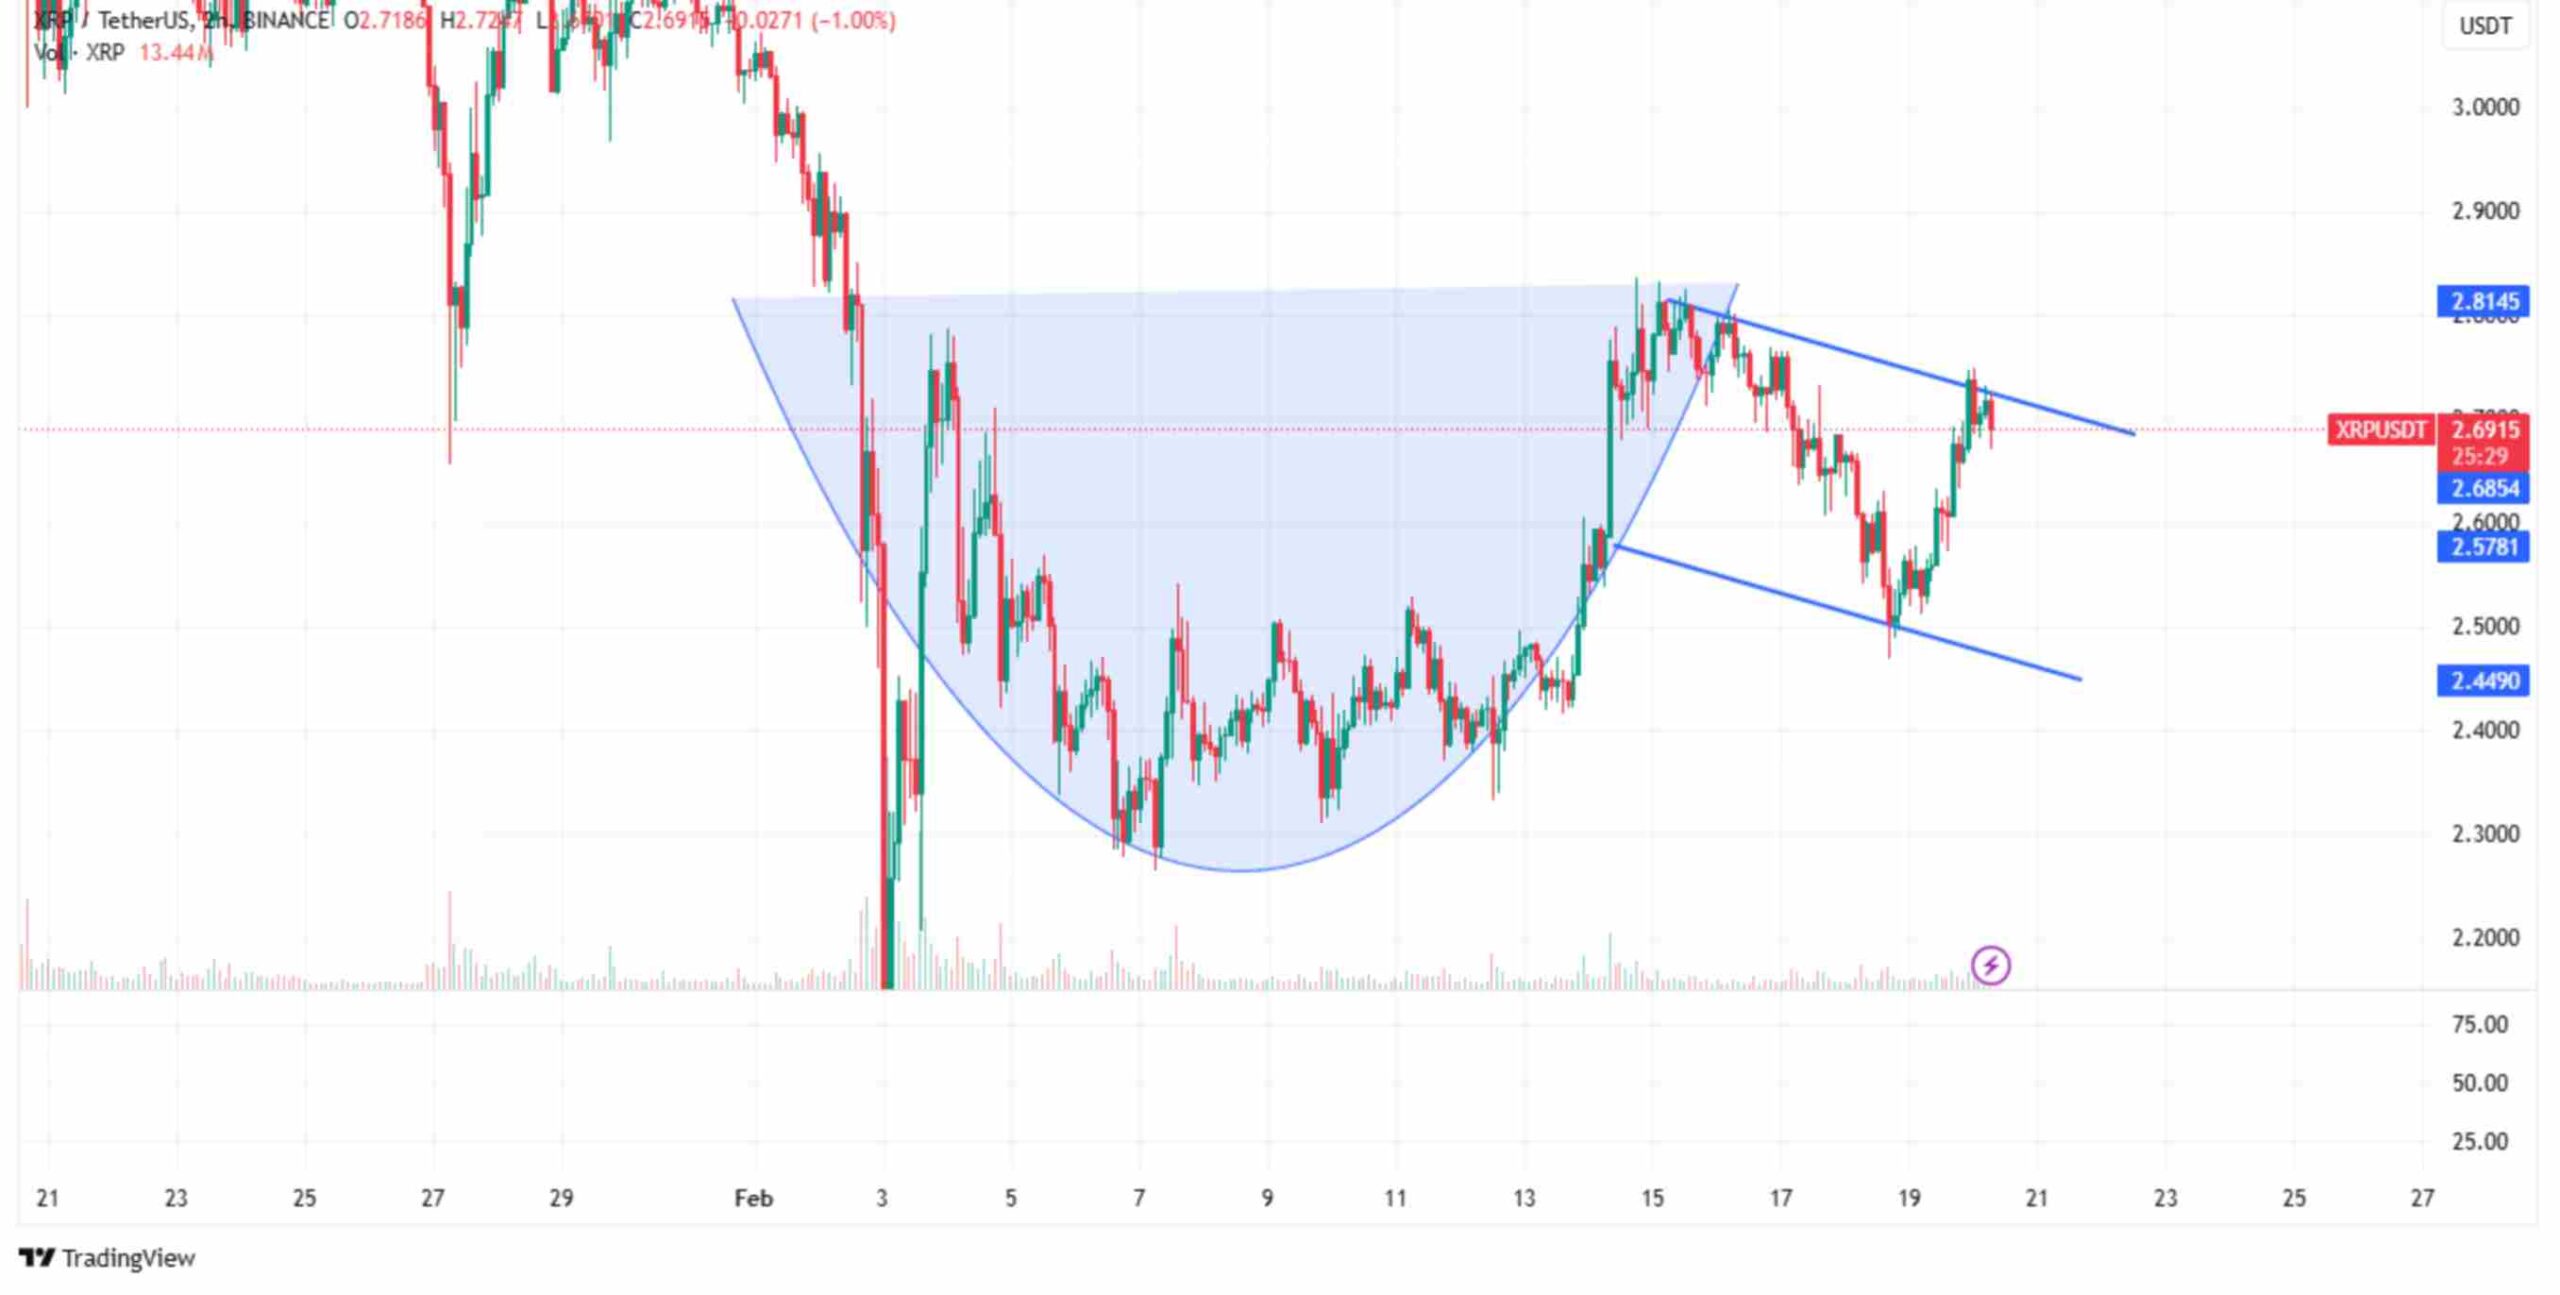
This setup indicates that XRP could be looking at a breakout towards the neckline resistance, somewhere around $2.75.
A successful breakout above this level may push the cryptocurrency’s price toward the $2.84 zone and then push toward the previous local high of $3.40.
Exchange Outflows Point to Stronger Demand
Another promising signal for XRP is the trend in exchange flows.
According to recent data from CryptoQuant, the cryptocurrency’s exchange reserves have been in a downtrend since November of last year.
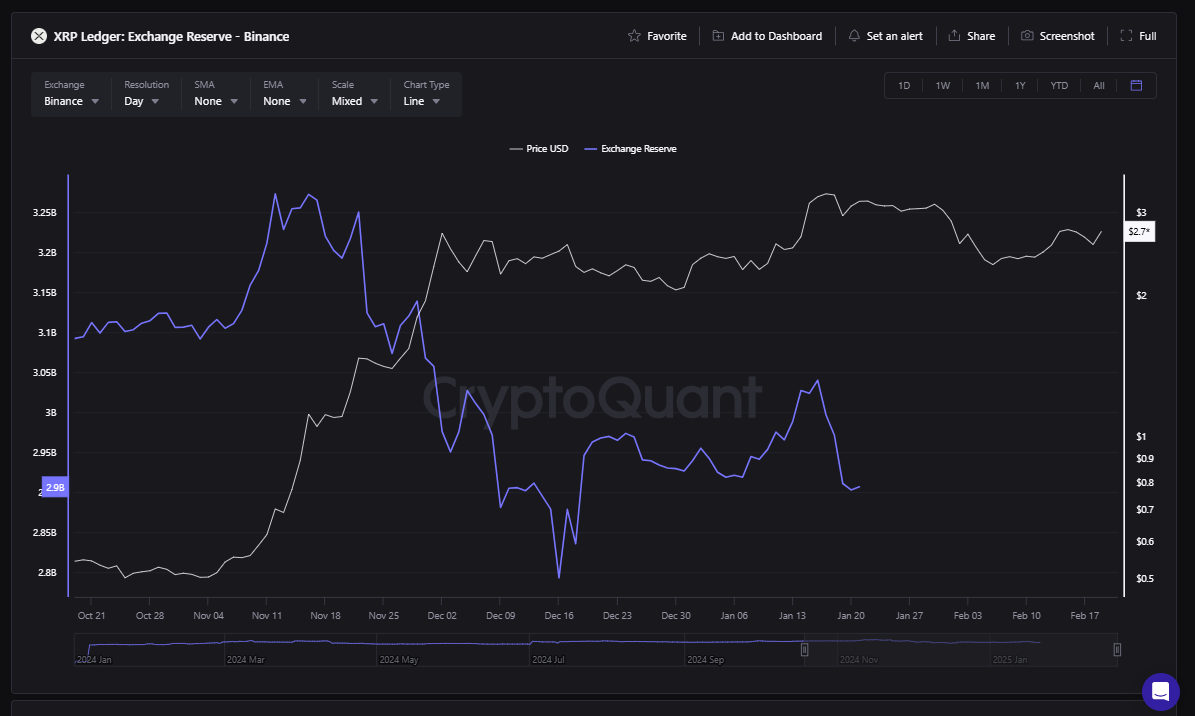
For some context, negative exchange flows typically point towards investors moving their tokens off exchanges.
This means that more and more of them are considering holding on to their tokens rather than selling.
The trend also reduces available supply, eases selling pressure, and creates scarcity for the said asset.
Interestingly, the decline in exchange reserves came amid the massive 330% rally in the price of the cryptocurrency, which saw it hit the $3.4 mark.
The bottom line is that several more investors are buying instead of selling. Therefore, if this trend continues, XRP could be gearing up for another push to the upside.
Technical Indicators Suggest Further Upside Potential
According to analysts, several more indicators are pointing towards a bullish outlook for cryptocurrency.
For example, analyst Dark Defender recently pointed out that if XRP were to reclaim the $2.77 resistance, this move could open the door for another move toward $3.00.
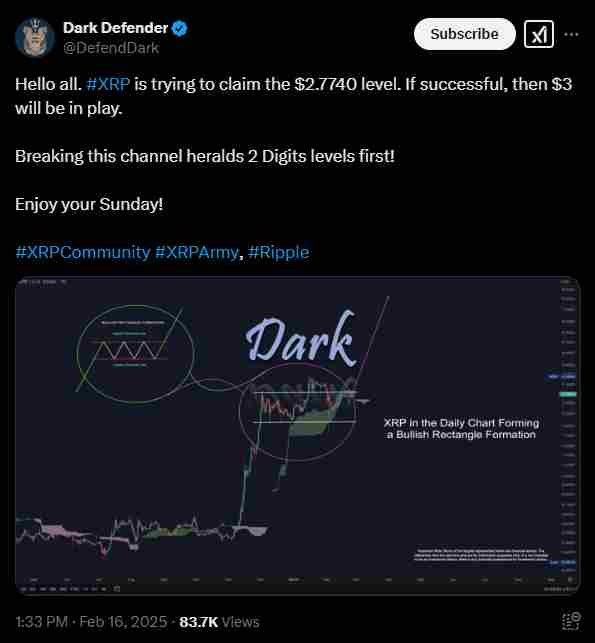
While this prediction for the cryptocurrency is encouraging, the charts still show that XRP will need to reclaim some key moving averages, particularly the 50-day SMA, before this push towards $3.
This level has acted as a crucial support in previous rallies, and a break above could be a strong signal that the bulls are back in control.
Can XRP Avoid Another Price Drop?
The outlook at this point is bullish. However, the weakness shown by XRP after failing to hold the $2.85 price level on 15 February is undeniable.
This move has raised concerns about the cryptocurrency’s ability to sustain itself against another price downside.
The 50-day SMA (red line) has been one of the most critical dynamic resistances for XRP, holding it up since early November of last year and guiding it from a price of $0.5 to a high of $3.4.
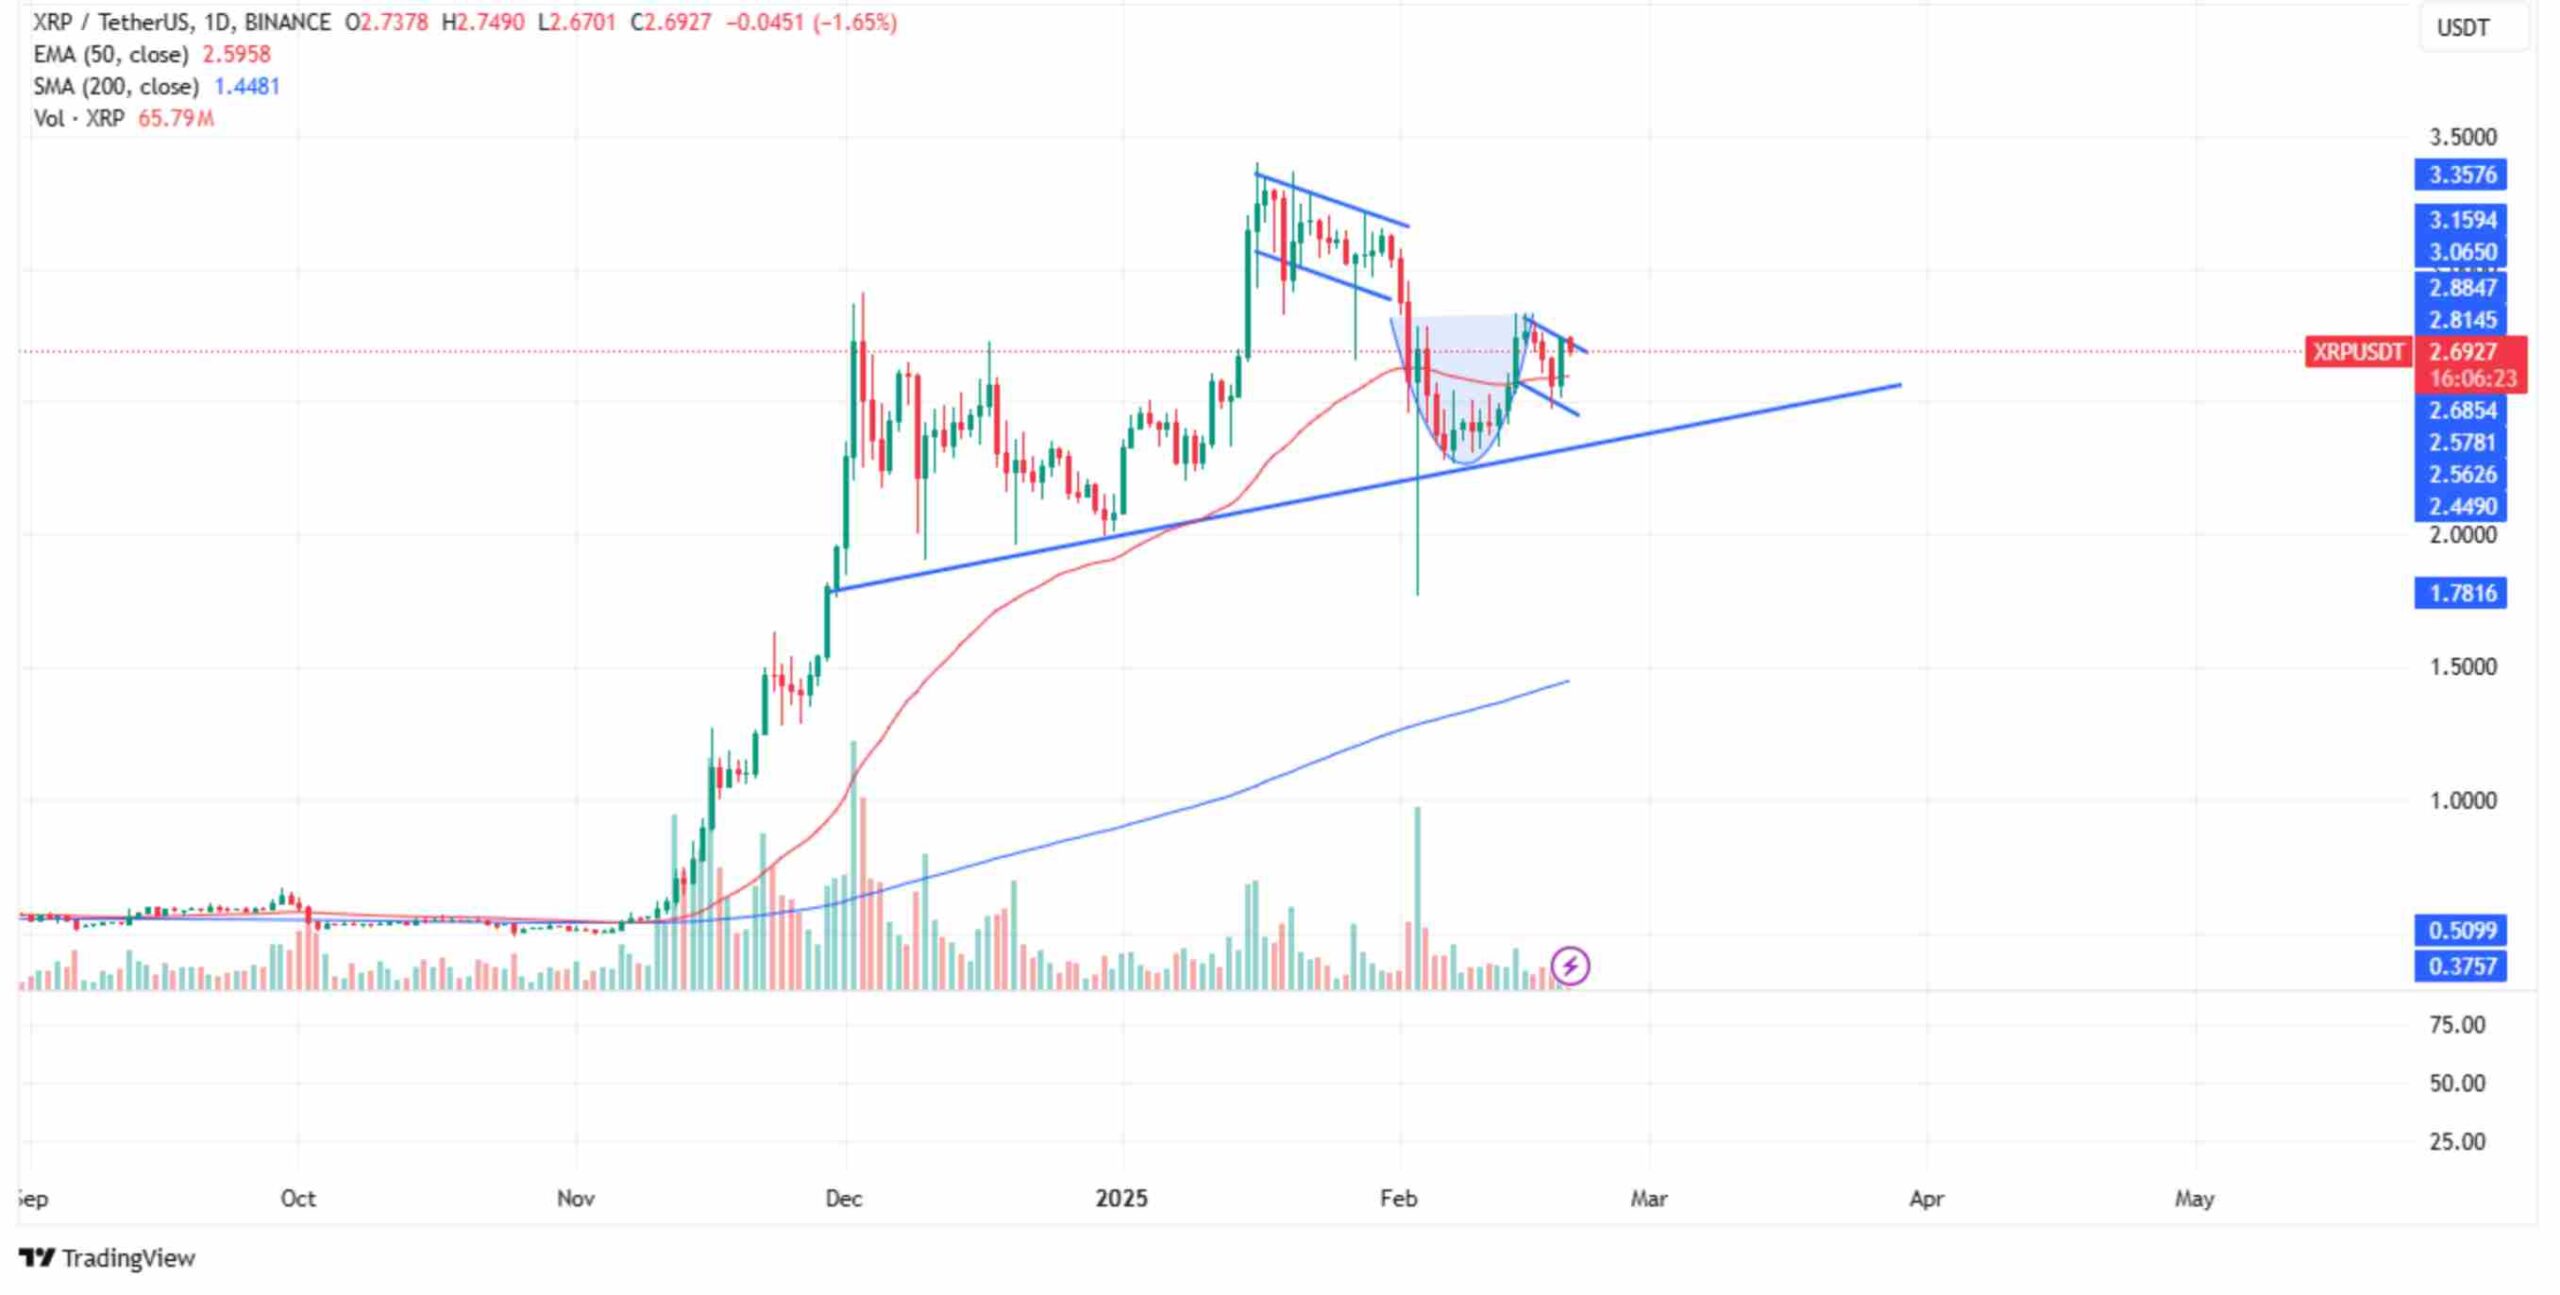
XRP is back above this moving average but needs to stay afloat to manage another strong rally to the upside.
If a break below this moving average occurs again, it could open the door to another deeper correction.
Could XRP Drop to $1.70?
Despite all of the strong bullish signals highlighted above, XRP is displaying some worrying signs.
The cryptocurrency is currently trading within a bear-flag pattern, and the bulls need to move fast to avoid another strong correction.
The cryptocurrency’s bear flag began to form after the drop from $3.13 to $1.76 in early February.
In essence, if a break below the lower trendline of this channel occurs, XRP could test $1.70 in a possible 32% decline.
Brazil Approves First Spot XRP ETF, Boosting Sentiment
Meanwhile, in terms of fundamentals, Brazil’s securities regulator, the Comissão de Valores Mobiliários, recently approved the country’s first spot XRP ETF.
This Hashdex Nasdaq XRP Index Fund is expected to soon be available for trading, even though an official launch date on Brazil’s B3 exchange has yet to be announced.
The development comes amid growing interest from all over the world in spot crypto ETFs.
Furthermore, Braza Group, a Brazilian financial firm, has also announced plans to launch a stablecoin pegged to the Brazilian Real on the XRP Ledger.
Overall, the current price action and developments on XRP present both bullish and bearish possibilities.
Traders and investors should watch out for what happens around $2.75 (the cup-and-handle breakout level).
The 50-day SMA and the $2.50 bear flag support are also great levels to watch out for.
If XRP holds above these levels, it could enter a sustained rally and reclaim some of its previous highs.